
Adani Enterprises share price TARGET 2025 to 2050 c̅ Analysis
🕰️30 Seconds Summary🕰️
About Adani Enterprises Ltd ( BSE, NSE : ADANIENT)
| Company Name | Adani Enterprises Limited |
| Former Name | Adani Exports Limited |
| Stock Exchange | NSE, BSE |
| Ticker Symbol | NSE : ADANIENT | BSE : 512599 |
| Headquarter | Ahmedabad, Gujarat |
| Founded in | 1993 |
| Major Shareholder | S.B. Adani Family Trust (~49.7%) |
| Market Cap. | INR 2.96 Trillion (₹ 2,957,010,000,000) |
| Revenue(2023) | INR 31,716 crore |
| Competitors / Peers | MMTC Ltd, Redington Ltd, Cello World Ltd. Aegis Logistics |
| Listing date | BSE – Nov 25, 1994 | NSE – June 04, 1997 |
| All-time high price | 4190.85 (Dec 21, 2022) |
| 52-week high | 3743.90 (June 03, 2024) |
| 52-week low | 2025.00 (Nov 22, 2024) |
ADANIENT Share Price Analysis : SHORT & LONG TERM
Chart analysis of Adani Enterprises Share Price
NIFTY, SENSEX & ADANIENT : A comparative analysis
ADANIENT is a part of NSE’s NIFTY index but not included in 30 companies of BSE’s SENSEX index. Looking at the comparative chart above, we can clearly see the it sometimes remain in sync with SENSEX but most of the time the share trades in its own way. Below is the comparative table of 5 year NIFTY, SENSEX & ADANIENT returns based on CLOSING Prices.
| Year | Nifty | Sensex | ADANIENT |
|---|---|---|---|
| 🔴 2024 | +8.80% | +8.17% | -11.24% |
| 🔴 2023 | +20.03% | +18.74% | -26.16% |
| 🟢 2022 | +4.33% | +4.44% | +125.7% |
| 🟢 2021 | +24.12% | +21.99% | +256.4% |
| 🟢 2020 | +14.90% | +15.75% | +130.1% |
From 2020 to 2022, ADANIENT gave massive returns when compared to both the major indices. Although in 2023 as well as in 2024, Adani Enterprises share provided a Negative Return. Keep reading, below we have got the peer comparison analysis for you.
Adani Enterprises Peer Comparison / Competitors analysis
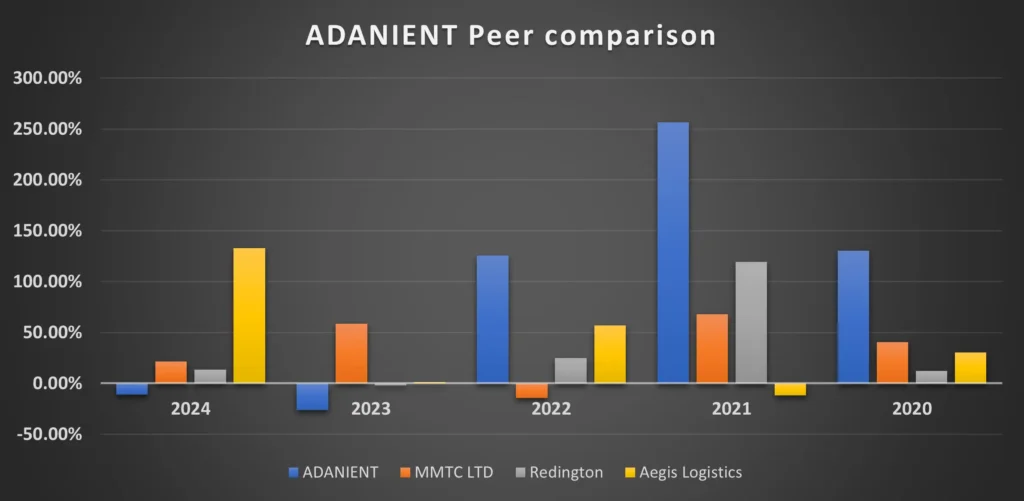
In this section, we will compare Adani Enterprises Ltd. to its top competitors. We will see how other companies performed year-on-year . Below is the comparative table of ADANIENT, MMTC, Redington & Aegis Logistics’ returns from 2020 to 2024 based on CLOSING Prices.
| Year | ADANIENT | MMTC LTD | Redington | Aegis Logistics |
|---|---|---|---|---|
| 2024 | -11.2% | +21.2% | +13.3% | +132.5% |
| 2023 | -26.1% | +58.3% | -2.4% | +1.1% |
| 2022 | +125.7% | -14.6% | +24.7% | +56.9% |
| 2021 | +256.4% | +67.8% | +119.3% | -11.9% |
| 2020 | +130.1% | +40.4% | +12.2% | +30.2% |
| Average Returns | +94.9% | +34.6% | +33.4% | +41.8% |
Here we can observe that Adani Enterprises Ltd. is the clear winner if we look at the 5-year average returns but the other companies also gave DECENT returns to the investors. Since Cello World Ltd. got listed in 2023, we did not considered it for comparison.
Adani Enterprises Share Price Long term analysis
If we consider the returns ever after taking average inflation rate of 6% per annum in account, it can be considered as Tremendous returns (ROI) almost ~400% in 5 years. Now we know about the historical price change, its time to look at how ADANIENT share can behave in coming days. Let’s analyze it on different timeframes.
Time-Frame analysis of Adani Enterprises : Hourly, Daily & Weekly
As by a simple timeframe chart analysis we can observe the following about ADANIENT share price –
| Time Frame | Observation |
|---|---|
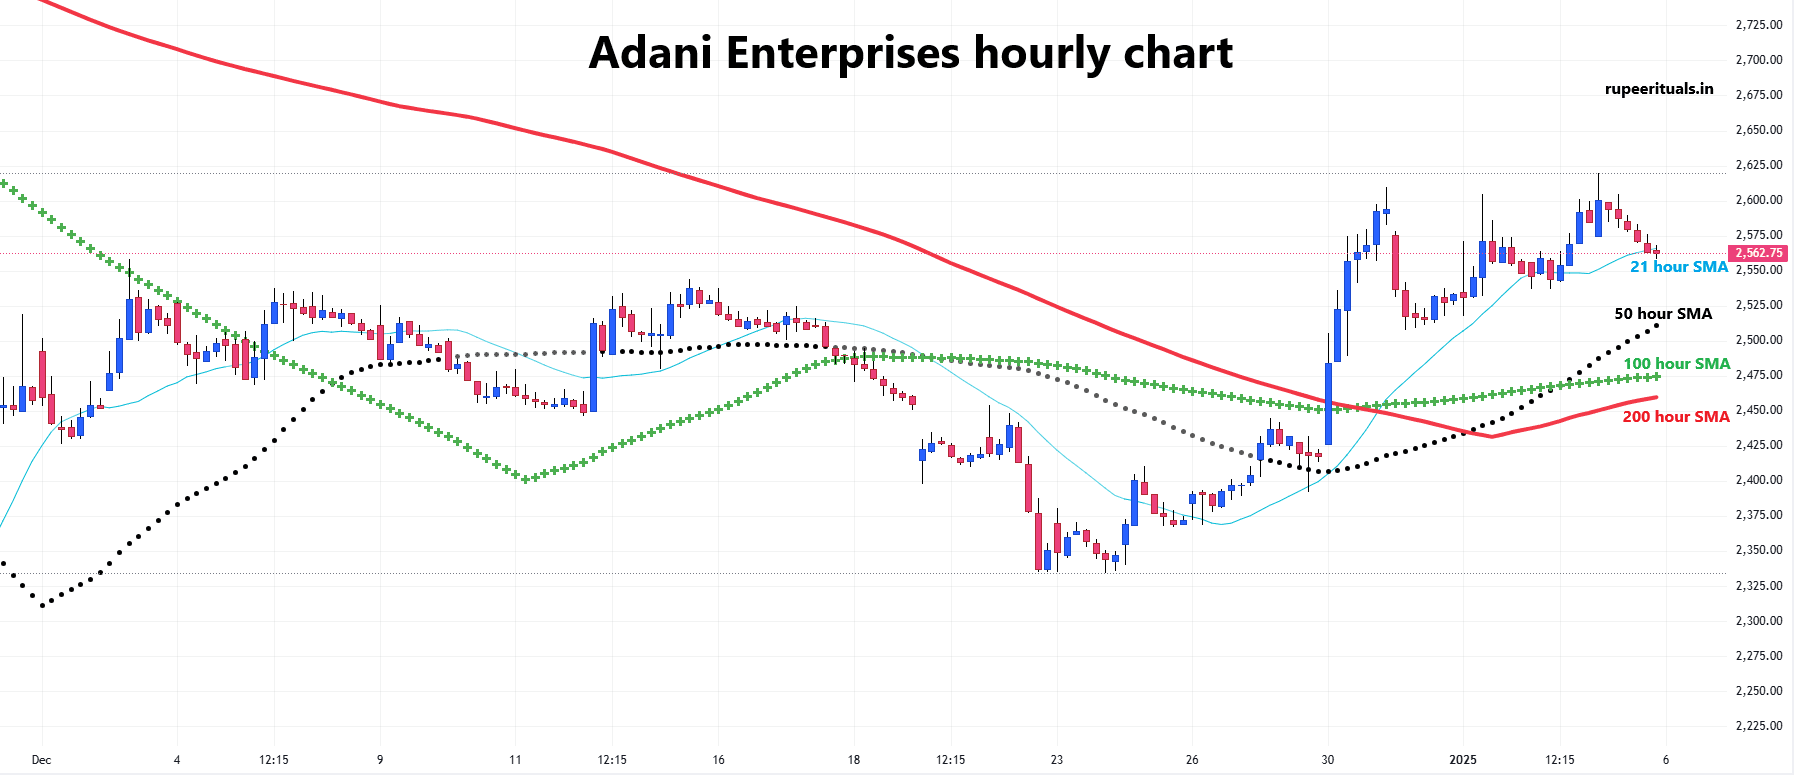 View Hourly Chart (Every candle represents ADANIENT share’s trading session of one hour. Each single candle represent the HIGH, LOW, OPEN, CLOSE of that particular hour) | On hourly time-frame, we can observe that Adani Enterprises share is trading above the 50 hour, 100 hour and 200 hour SMAs while 21 hour is trending sideways. This indicates that the ADANIENT share price have a uptrend (Bullish outlook) for short term. |
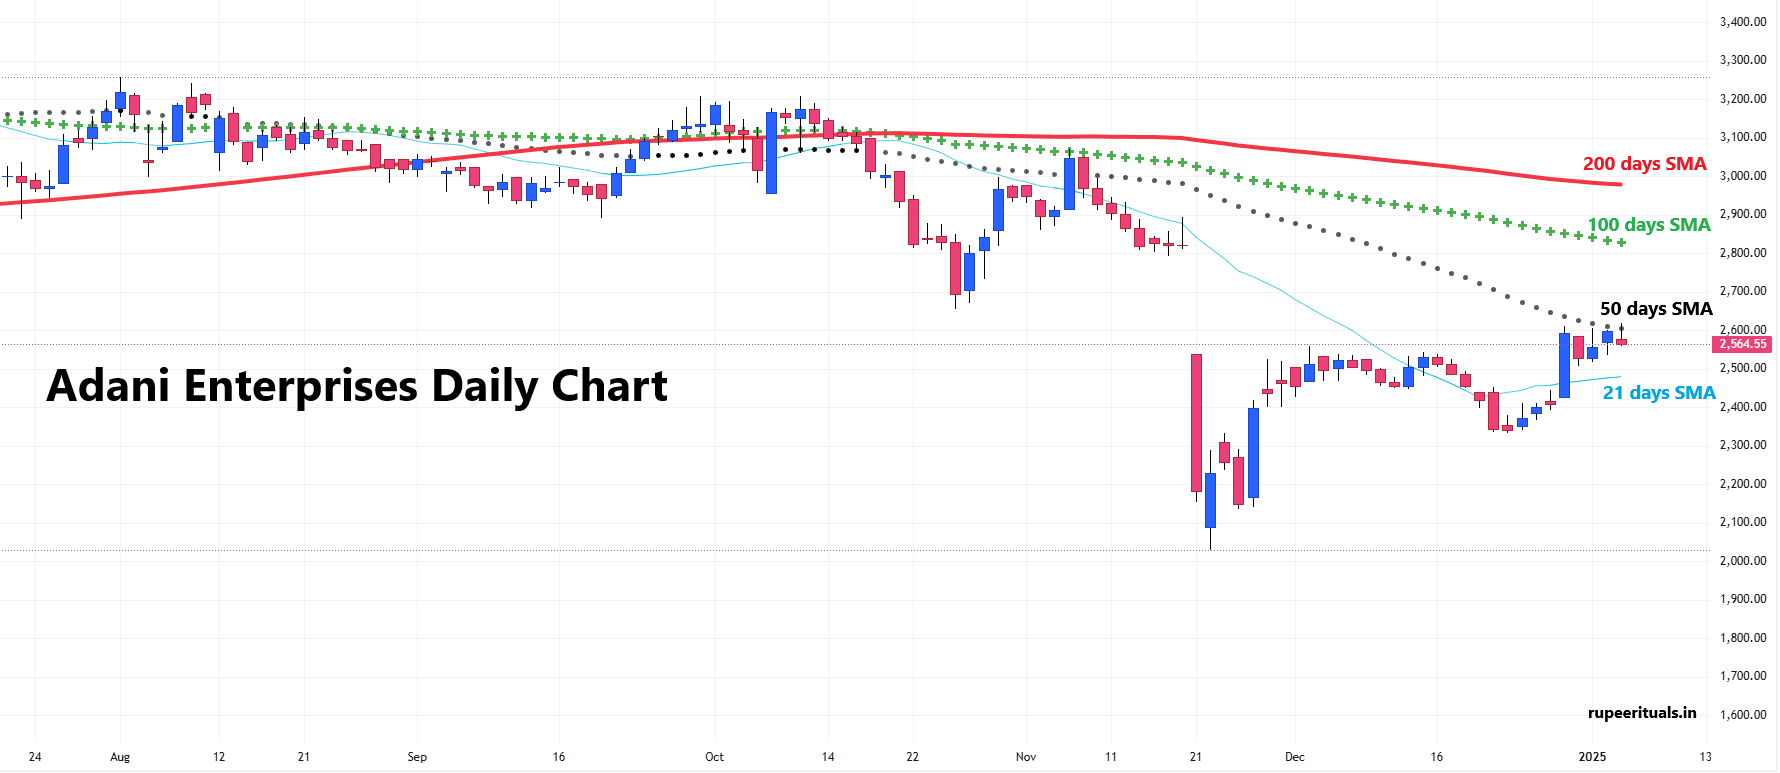 View Daily Chart (Every candle represents ADANIENT share’s trading session of one day. Each single candle represent the HIGH, LOW, OPEN, CLOSE of that particular day) | On daily time-frame, we can observe that Adani Enterprises share is trading below all the 50 Day, 100 Day and 200 Day SMAs BUT slightly above the 21 Day SMA. This is the indicator of Bearish-to-sideways trend for medium term. |
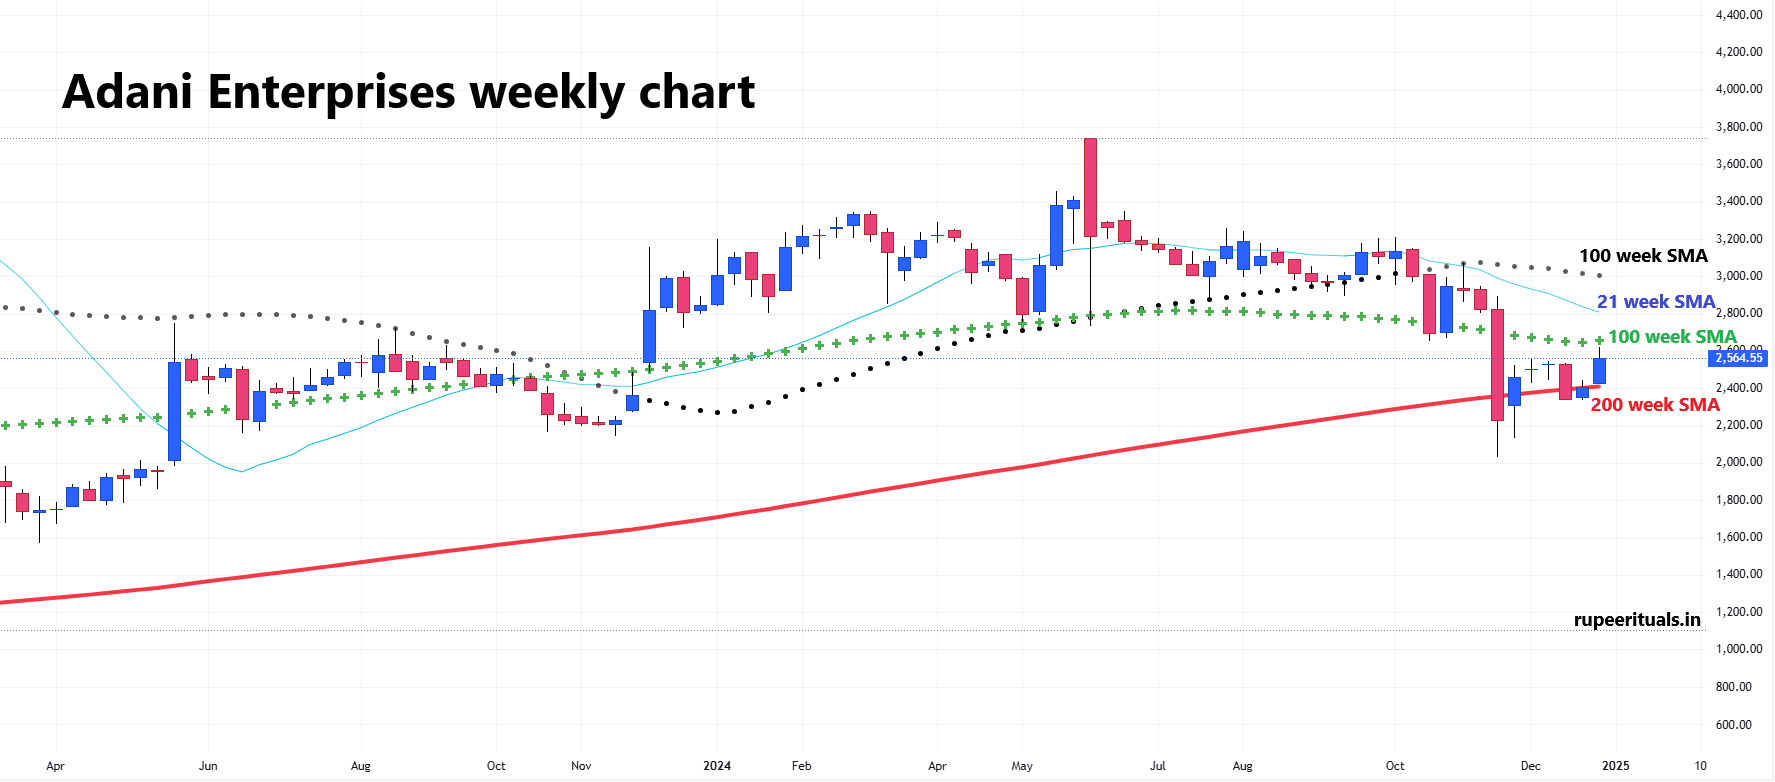 View Weekly Chart (Every candle represents ADANIENT stock’s trading session of one week. Each single candle represent the HIGH, LOW, OPEN, CLOSE of that particular week) | On the weekly time-frame Adani Enterprises share is trading below 21 weeks, 50 weeks and 100 weeks SMA but above 200 weeks SMA. This indicates that ADANIENT share is in sideways-to-bearish trend , if we look at it from a very long term perspective. |
Since there is a mixed perspective shown by SMAs about Adani Enterprises share like in Hourly Timeframe, everything looks good but 21-hour SMA is sideways. In Daily & Weekly Timeframe & , Adani share is trading below all SMAs except the smallest once. This shows a little confusion in the minds of shareholders. In the right / below(mobile), you can see the current suggestions of experts about how the Adani Enterprises share may behave in coming days.
Adani Enterprises Ltd’s (BSE, NSE : ADANEINT) Key Indicator Values
| Indicator | Value | Interpretation |
|---|---|---|
| Profit Before Income Tax/Share (in Rs.) | 40.14 (Mar 24)- +48.50% increase | Adani Enterprises’ PBIT / Share ratio was 27.03 (March 23). This has also shown a increase as compared to previous year. |
| Earning-per-Share (EPS) | 24.95 (FY24) – +74.59% increase | Adani Enterprises’ EPS has been increased from 14.29 Rs (FY23). |
| Debt-to-Equity (D/E) ratio | 0.31 (FY24) | Adani Enterprises’ D/E ratio is increased if we compare it with previous years 0.21(FY23). |
Adani Enterprises Share Price Target : SHORT & LONG TERM
Adani Enterprises Share Price Target 2025, 2026, 2027, 2028, 2029
Adani Enterprises Share Price Target 2030, 2035, 2040, 2050
These projections are provided without considering any kind of share split. These can be considered as share price targets on overall value of Adani Enterprises share price today.
👷🏾♂️Can Ambuja Cements become a building block of your portfolio in 2025 ? Read this to find out…
Adani Enterprises Share Price Target for 2025 (month-wise)
Adani Enterprises Share Price Target for 2026 (month-wise)
Adani Enterprises Share Price Target for 2027 (month-wise)
🏖️ Can EaseMyTrip’s share sponsor your next trip in 2025? Read this to find out…
Conclusion
Don’t forget to check out our FAQs, you may find the answer of your query. Please rate this post if you like it, suggestions are also welcomed. 🤑HAPPY INVESTING🤑.
Frequently Asked Questions (FAQs)
1) Is it good to buy Adani Enterprises share?
As per our analysis, we recommend Adani Enterprises Ltd. (BSE, NSE : ADANIENT) as a MODERATE BUY. But yes it is a good company to keep in your portfolio. Considering its diversified business dimensions and strong back-support, you can invest some amount into Adani Enterprises.
2) What is the target price of Adani enterprises in 2025?
In 2025, we are expecting Adani Enterprises share price to reach ₹ 3480 which is a 37.61% return on 2024’s closing price of ₹2528.95
3) What is the share price target for Adani Enterprises in 2050?
By 2050, the Adani Enterprises share price could reach around ₹ 43,700 (without split).
4) What is the Adani Enterprises share price target for 2040?
By 2040, the Adani Enterprises share price could reach around ₹ 21,450 (without split).
5) What is the Adani Enterprises share price target for 2030?
As per our analysis, Adani Enterprises share price may hit a high of ₹ 8660 in 2030.
6) What is the forecast for Adani Enterprises?
We are expecting the Adani Enterprises share price to reach ₹ 3480 in 2025, ₹ 8660 by 2030, rise to ₹ 16380 by 2035, grow to ₹ 21450 by 2040, and hit ₹ 43700 by 2050
💡 Can NTPC light up your portfolio with profits ? Read this to find out…
Disclaimer : Not an Investment Advice
The content shared in the article “Adani Enterprises share price TARGET 2025 to 2050 c̅ Analysis” is for general information only. It’s not intended as financial, investment, or professional advice. Always consult a qualified professional—whether legal, financial, or tax-related—before making any investment decisions.
