Skip to content
rupee rituals logo
  • Blog
  • Calculators
  • About Us
  • Contact us
  • Terms & ConditionsExpand
    • Privacy Policy
    • Disclaimer
  • हिन्दी
rupee rituals logo
Defence Share Price Targets

Mazagon Dock Share Price Targets 2025 to 2050 : Investment Insights

ByNeeraj Maran
🇮🇳 हिन्दी में पढ़ें

30 Seconds Summary

For investors seeking solid opportunities in India’s public sector, Mazagon Dock Shipbuilders Ltd. (NSE, BSE: MAZDOCK) stands out as a strong contender. As a key force in the country’s defense and shipbuilding industry, backed by the Government of India, MAZDOCK shows exceptional potential for long-term steady growth. Based on our updated analysis, the stock could potentially reach ₹3,215.40 by 2026, ₹7,617.55 by 2030, ₹12,268.10 by 2035, ₹19,757.95 by 2040, and may rise to an impressive ₹51,246.05 by 2050.

Are you keeping an eye on India’s booming defense and shipbuilding sector? Then Mazagon Dock Shipbuilders Ltd. (MAZDOCK) is a stock you can’t afford to ignore. Backed by the Indian government and riding the wave of increasing defense expenditure, MAZDOCK has not only delivered strong performance in recent years but also shown signs of long-term growth potential.

In this blog post “Mazagon Dock Share Price Targets 2025 to 2050 : Investment Insights“, we will look at the comprehensive forecast of MAZDOCK share long term price targets which will be backed by data-driven insights and technical trends. This detailed analysis aims to guide your investment decisions with clarity.

  • 30 Seconds Summary
  • About Mazagon Dock Shipbuilders Ltd. (NSE, BSE: MAZDOCK)
  • Mazagon Dock Shipbuilders Share Price Analysis : SHORT & LONG TERM
  • MAZDOCK's Key indicators, Comparative analysis with major indices and peer companies, Long term price analysis
  • Mazagon Dock Share Price Targets : SHORT & LONG TERM
  • Conclusion
  • Frequently Asked Questions (FAQs)
  • Disclaimer : Not an Investment Advice

About Mazagon Dock Shipbuilders Ltd. (NSE, BSE: MAZDOCK)

Company NameMazagon Dock Shipbuilders Limited
Stock ExchangeNSE, BSE
Ticker SymbolNSE : MAZDOCK | BSE : 543237
Face Value₹ 5 per share
HeadquarterMumbai, Maharashtra
SectorShip Building & Allied Services (Defense)
Founded in1934
Market Cap.INR 1,40,174.55 Crore (₹ 1,401,745,500,000)
RevenueINR 11,431.89 Crore
Competitors / PeersBharat Electronics Limited (BEL), Garden Reach Shipbuilders & Engineers (GRSE), Hindustan Aeronautics Ltd (HAL), Bharat Dynamics Ltd. (BDL), Paras Defence and Space Technologies Ltd. (PARAS)
Listing dateBSE & NSE – October 12, 2020
All-time high price₹ 3775.00 (May 29, 2025)
All-time low price₹ 82.00 (October 13, 2020)

Mazagon Dock Shipbuilders Share Price Analysis : SHORT & LONG TERM

Before getting into Mazagon Dock share price targets, we will first dive in MAZDOCK’s technical chart and compare the company’s performance with major indices like NSE’s NIFTY50 and BSE’s Sensex. This section will cover a detailed long-term share price analysis and timeframe analysis of MAZDOCK’s stock.

Chart analysis of Mazagon Dock Share Price

In MAZDOCK share price chart we can clearly see that from its listing on October 12, 2020 to August 29, 2022, no one cared about this stock. But in August 2022, Mazagon Dock gave a breakout and started moving up. It went up from ₹170 to ₹470 & then traded a little downwards to sideways till June 2023. On June 05 2023, Mazagon Dock broke its range again and shot up from ₹450 to ₹1246 in four months, till September 2023. After some profit booking, it started to trade in a range of ₹930 to 1230. On May 17 2024, MAZDOCK broke this range too, gone up till ₹1742, came down to test the support & then skyrocketed to ₹2930.

After creating the high of ₹2930, as per its previous pattern, Mazagon Dock shares came down, traded in a range of ₹1930 to ₹2720 till April 2025. On April 29, 2025, it broke the range and started moving up, came back to test the support but gained its momentum and gone up to ₹3775 on May 29 2025. On its First trading day of 2024 (Jan 01, 2024) it OPENED its year at the price of ₹2,230.00 & now in the year 2025, it is trading on ₹3478.00 (June 01, 2025) showed a positive return of +56.13%.

Since June 1, 2025, a slight decline has been observed in this stock. After experiencing several fluctuations, MAZDOCK traded at its lowest price of the year—2,057.40. BUT, It is now once again moving forward in an attempt to scale new heights.

MAZDOCK’s Key indicators, Comparative analysis with major indices and peer companies, Long term price analysis

NIFTY, SENSEX & MAZDOCK : A comparative analysis

Mazagon Dock Shipbuilders Limited is neither a part of NSE’s NIFTY index nor included in BSE’s SENSEX index. Still by observing the comparative chart above, we can clearly see the mixed synchronization between MAZDOCK & SENSEX. Sometimes they walk together like buddies while sometimes they behave like total strangers. Below is the comparative table of 5 year NIFTY, SENSEX & MAZDOCK returns based on CLOSING Prices.

YearNiftySensexMAZDOCK
🟢 2025+10.51%+9.06%+11.78%
🟢 2024+8.80%+8.17%+95.34%
🟢 2023+20.03%+18.74%+187.57%
🟢 2022+4.33%+4.44%+184.49%
🟢 2021+24.12%+21.99%+27.63%
🟢 2020+14.90%+15.75%listing year

From 2021 till 2024, MAZDOCK gave the massive returns when compared to both the major indices. It always outperformed both the indices with a huge margin except in 2021. Keep reading, in next Tab we have got the peer comparison analysis for you.

Mazagon Dock Peer Comparison / Competitors analysis

Now we will compare Mazagon Dock Shipbuilders Ltd. to its top competitors. We will see how its peer companies performed year-on-year . Below is the comparative table of Bharat Electronics Limited (BEL), Garden Reach Shipbuilders & Engineers (GRSE), Hindustan Aeronautics Ltd (HAL), Bharat Dynamics Ltd. (BDL)’s returns from 2020 to 2024 based on CLOSING Prices.

YearMAZDOCKHALBELGRSEBDL
2025+11.78%+5.03%+36.31%+51.21%+30.61
2024+95.3%+49.0%+59.1%+85.1%+31.1%
2023+187.6%+121.5%+84.3%+80.2%+81.4%
2022+184.5%+109.0%+42.7%+117.0%+142.4%
2021+27.6%+43.0%+75.0%+14.9%+14.5%
2020listing year+15.9%+19.9%-2.2%+15.6%
Average Returns+123.7%+67.7%+56.2%+59.0%+57.0%

Here we can observe that MAZDOCK performance is better than its peers if we look at the 5-year average returns.
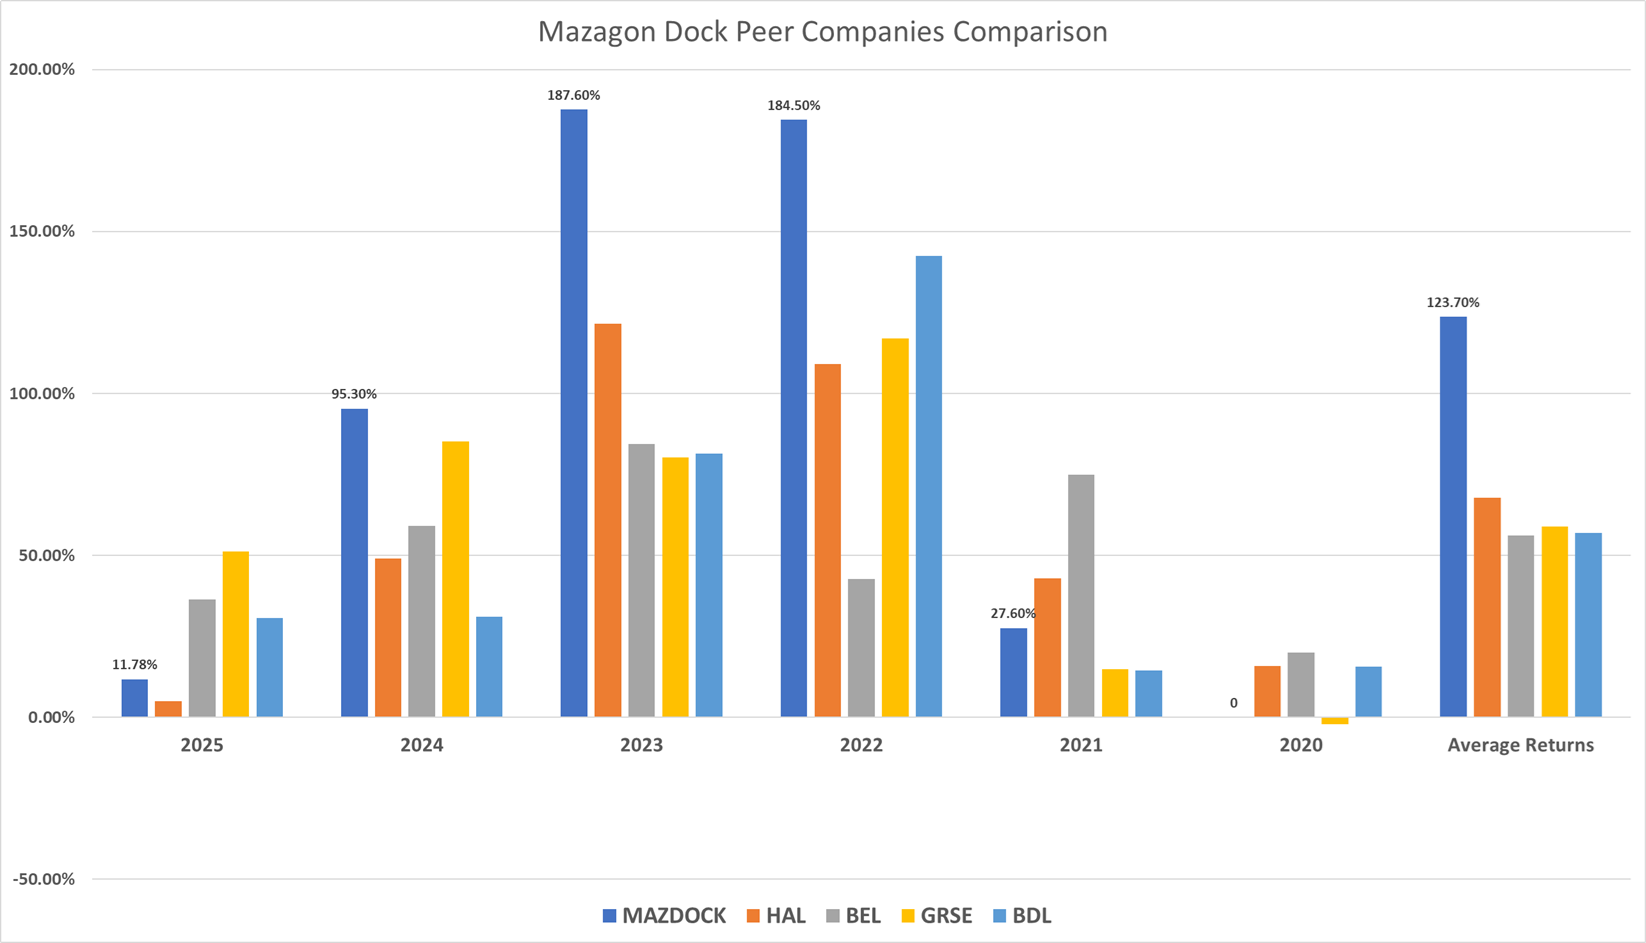
Mazagon Dock Peer Comparison
We’ve highlighted Mazagon Dock’s returns to help you understand and compare its performance more clearly.

Mazagon Dock Shipbuilders Share Price Long term analysis

From the given table we can observe that in the previous 5 years, MAZDOCK shares gave TREMENDOUS returns to its investors from 2022 till 2024. These percent changes are based on the HIGH price (TARGET) basis.

YearCloseLowHigh% change on High
🟢 20252490.201918.053775.00+128.84%
🟢 20242227.80897.702930.00+135.84%
🟢 20231140.45306.001242.35+165.35%
🟢 2022396.60112.70468.20+191.71%
🟢 2021139.4095.95160.50+40.85%
🟢 2020109.2582.00113.95listing year

That’s remarkable, don’t you think? Even if we take average inflation rate of 6% per annum into account, it can still be considered as MIND-BLOWING returns (ROI) almost ~500% in 4 years. Now we know about the historical price change, its time to dive into how MAZDOCK share might behave in coming days. Let’s look at its Fundamental Key Indicators in the next tab.

Mazagon Dock Shipbuilders (BSE, NSE : MAZDOCK) Key Indicator Values

IndicatorValueInterpretation
Profit Before Income Tax/Share (in Rs.)80.04 (Mar 25)MAZDOCK’s PBIT / Share ratio was 122.29 (March 24), 71.18 (March 23) & 39.36 (March 22).
Earning-per-Share (EPS)57.63 (FY25)MAZDOCK’s EPS has been decreased from 91.50(FY24), while increased from 53.19 Rs (FY23) & 29.08 (FY22).
Debt-to-Equity (D/E) ratio0.00 (FY25)MAZDOCK’s D/E ratio is constant as compared to previous years. Its a DEBT FREE company.

Time-Frame analysis of Mazagon Dock : Daily, Weekly and Monthly

As by a simple timeframe chart analysis we can observe the following about MAZDOCK share price which will help us more in reaching our final outcome i.e. Mazagon Dock share price targets-

Time FrameObservation
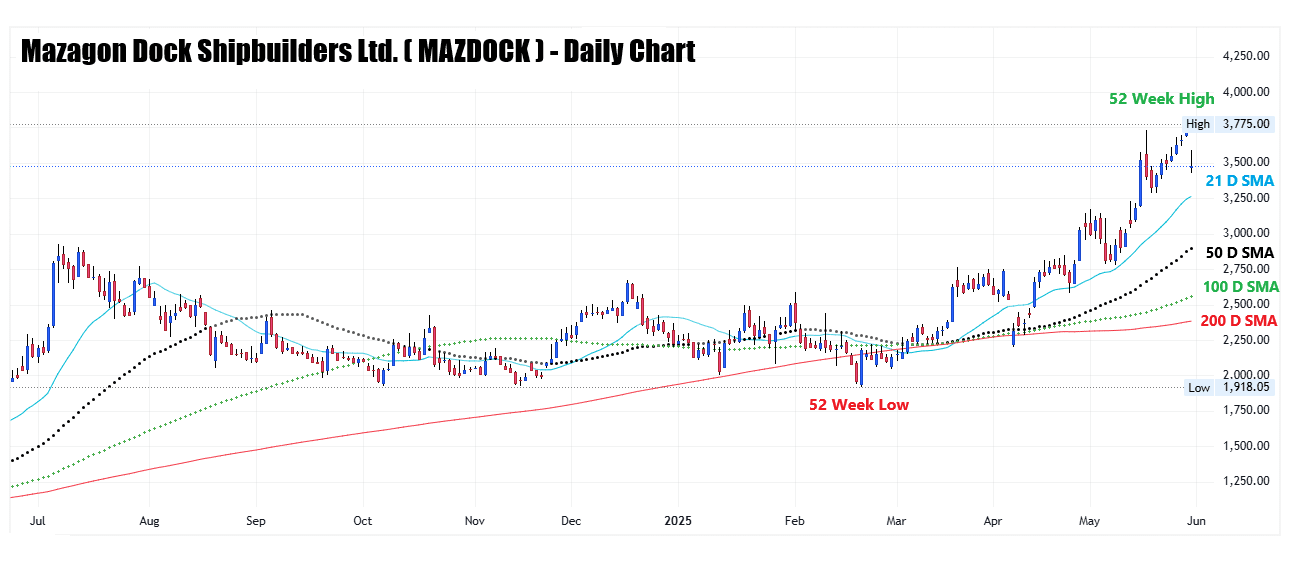
Daily chart for Mazagon Dock share price target
View Daily Chart

(Every candle represents MAZDOCK share’s trading session of one day. Each single candle represent the HIGH, LOW, OPEN, CLOSE of that particular day)
On daily time-frame, we can observe that Mazagon Dock Shipbuilders’ share is trading ABOVE all the 21 Day, 50 Day, 100 Day and 200 Day SMAs. This is the indicator of clear BULLISH trend for medium term. Observe that, it created 52-weeks High & Low both in a span of 4 months.
Monthly chart for Mazagon Dock share price target
View Weekly Chart

(Every candle represents MAZDOCK stock’s trading session of one week. Each single candle represent the HIGH, LOW, OPEN, CLOSE of that particular week)
On the weekly time-frame Mazagon Dock share is trading above all 21 weeks, 50 weeks, 100 weeks & 200 weeks SMA. This indicates that MAZDOCK share is in clear Bullish trend, if we look at it from a long term perspective.
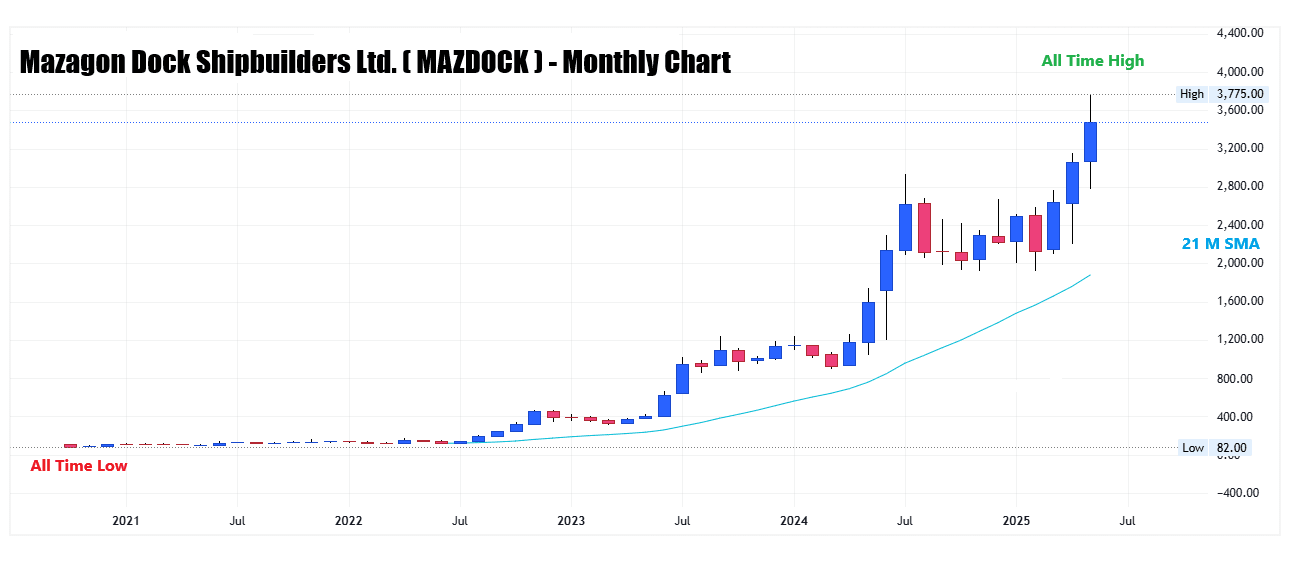
Monthly chart for Mazagon Dock share price target
View Monthly Chart

(Every candle represents MAZDOCK stock’s trading session of one month. Each single candle represent the HIGH, LOW, OPEN, CLOSE of that particular month)
On the Monthly time-frame, Mazagon Dock share is trading above all 21 month SMA, although we cannot interpret anything from these SMAs. But, you can observe its growth from mid-2022 to 2025. It Looks like a pattern of Four Months UP – then 6 Months Down. Try to observe it in the chart.

Since there is a POSITIVE perspective shown by SMAs in Daily as well as Weekly time-frames & while observing the directions of the SMAs, we can find that MAZDOCK’s direction is towards uptrend in Weekly & Daily time-frames.

Mazagon Dock Share Price Targets : SHORT & LONG TERM

Mazagon Dock Share Price Target 2025, 2026, 2027, 2028, 2029

YearShare Price Target
2025₹ 3787.25
2026₹ 3215.40
2027₹ 4508.65
2028₹ 5759.20
2029₹ 6623.80
Mazagon Dock Share Price Target 2025, 2026, 2027, 2028, 2029
  • By 2025, Mazagon Dock’s share price was expected to reach ₹3,787.25 but it reached to ₹3,775.00, reflecting an approximate 69.45% increase from its 2024 closing price of ₹2,227.80.
  • By 2026, the stock could rise further to ₹3,215.40.
  • By 2027, the share price is projected to climb to ₹4,508.65, marking a 40.22% increase from 2026.
  • By 2028, the price might continue its growth, reaching ₹5,759.20, showing a 27.73% growth from 2027.
  • By 2029, Mazagon Dock share price target could be around ₹6,623.80, representing a 197.3% gain from its 2024 closing price.

Mazagon Dock Share Price Target 2030, 2035, 2040, 2045, 2050

YearStock Price Target
2030 ₹ 7617.55
2035 ₹ 12268.10
2040 ₹ 19757.95
2045 ₹ 31820.35
2050 ₹ 51246.05
Mazagon Dock share price target 2030, 2035, 2040, 2045, 2050 (without split)
  • By 2030, Mazagon Dock’s share price is projected to reach ₹7,617.55, delivering an approximate 205.8% return from its 2025 closing price of ₹2,490.20.
  • By 2035, the stock could climb to ₹12,268.10, representing a 392.8% gain from 2025 levels.
  • By 2040, Mazagon Dock Shipbuilders’ share value is expected to rise to ₹19,757.95, marking a 693.3% increase from its 2025 closing price.
  • By 2045, the share value could reach ₹31,820.35, reflecting a 1,178.0% surge compared to 2025.
  • By 2050, looking even further ahead, the Mazagon Dock share price target could be ₹51,246.05, indicating an impressive 1,958.1% growth from its 2025 closing price.

These projections are provided without considering any kind of share split. These can be considered as share price targets on overall value of Mazagon Dock Shipbuilders Ltd. (MAZDOCK) share price today.

Mazagon Dock Share Price Target 2026 (month-wise)

MonthStock Price Target
January 2026₹ 2541.55
February 2026₹ 2617.50
March 2026₹ 2780.10
April 2026₹ 2640.35
May 2026₹ 2755.95
June 2026₹ 2860.70
July 2026₹ 2937.55
August 2026₹ 3018.35
September 2026₹ 3098.85
October 2026₹ 3134.10
November 2026₹ 3215.40
December 2026₹ 3104.75
BSE, NSE : MAZDOCK Share Price Target for 2026 (month-wise)

As per our analysis of Mazagon Dock share price target 2026, we are expecting that the prices may rise up to ₹3215.40 by 2026.

Mazagon Dock Share Price Target 2027 (month-wise)

MonthStock Price Target
January 2027₹ 3270.05
February 2027₹ 3317.20
March 2027₹ 3395.15
April 2027₹ 3435.30
May 2027₹ 3607.25
June 2027₹ 3698.65
July 2027₹ 3850.40
August 2027₹ 3978.15
September 2027₹ 4108.65
October 2027₹ 4362.05
November 2027₹ 4508.65
December 2027₹ 4442.95
BSE, NSE : MAZDOCK Share Price Target for 2027 (month-wise)

As per our analysis of Mazagon Dock share price target 2027, we are expecting that the prices may rise up to ₹4508.65, offering an approximate +45.21% return on its 2026’s closing price of ₹3104.75.

Conclusion

Mazagon Dock Shipbuilders Limited (BSE, NSE : “MAZDOCK”), founded in 1934, carries a legacy of over 90 years and has evolved into one of India’s most important defense PSU companies. With a strong market cap of ₹1.40 lakh crores and an annual revenue of ₹11,431.89 crores, MAZDOCK continues to make headlines. It reached an all-time high of ₹3,775 on May 29, 2025, and has consistently outperformed the broader indices and most of its peers year after year.

Investors who stayed invested have seen over 500% returns in just 4 years, making it one of the top-performing PSU stock. With strong fundamentals and a bullish outlook across daily, weekly, and monthly charts, MAZDOCK could potentially climb as high as ₹51,246 by 2050. For investors looking to ride India’s defense and infrastructure growth story, Mazagon Dock could be a powerful long-term contender.

78
What's your view on NIFTY for the Next One Year ?

Frequently Asked Questions (FAQs)

1) Is Mazagon Dock Shipbuilders a good share to buy?

✔️ As per our analysis, we recommend Mazagon Dock Shipbuilders Ltd. (BSE, NSE : MAZDOCK) as a STRONG BUY for a long term investor. As a key public sector undertaking backed by the Government of India, the company has a strong order book, consistent revenue growth, and a strategic role in national defense infrastructure. With increasing demand for indigenous warships and submarines, MAZDOCK has shown impressive stock performance and potential for further gains.

2) What is the price target for Mazagon Dock in 2026?

✔️ ₹3215.40 is the Mazagon Dock share price target 2026 as per our analysis.

3) What is the Mazagon Dock share price target for 2050?

✔️ By 2050, the Mazagon Dock Shipbuilders share price target could be around ₹51,246 (without considering any split).

4) What is the Mazagon Dock share price target for 2040?

✔️ By 2040, the Mazagon Dock share target could be around ₹19,757 (without considering any split).

5) What is the Mazagon Dock share price target for 2030?

✔️ As per our analysis, Mazagon Dock share price target can be a high of ₹7617.55 in 2030.

6) What can be the Mazagon Dock share price target tomorrow?

✔️ Since Mazagon Dock share’s average daily move is around +/- 2.00%. We can estimate +2.00% or -2.00% of previous day’s close for MAZDOCK share price target tomorrow.

7) What is the Mazagon Dock share price target for 2045?

✔️ As per our analysis, Mazagon Dock share price target can be a high of ₹31820.35 in 2030.

8) What is the price target for Mazagon Dock in 2027?

✔️ As per our analysis, Mazagon Dock share price target can be a high of ₹4508.65 in 2027.

9) What is the price target for Mazagon Dock in 2028?

✔️ ₹ 5759.20 is the Mazagon Dock share price target 2028 as per our analysis.

Disclaimer : Not an Investment Advice

The content shared in the article “Mazagon Dock Share Price Targets 2025 to 2050 : Investment Insights” is for general information only. It’s not intended as financial, investment, or professional advice. Always consult a qualified professional—whether legal, financial, or tax-related—before making any investment decisions. Please rate this post if you like it, suggestions are also welcomed.

Rated 4.8/5 by 37 Readers
  • Author
  • Recent Posts
Neeraj Maran
Neeraj Maran
I am trading financial instruments like Equity shares, F&O, Commodities & sometimes Forex since 2013. During my Post Graduation (MBA-Finance), I got interested in financial markets and started learning it from various sources. I started this blog to share my experience and knowledge with you & to help you in taking informative investment decisions.
Neeraj Maran
Latest posts by Neeraj Maran (see all)
  • Mazagon Dock Share Price Targets 2025 to 2050 : Investment Insights - June 1, 2025
  • Suzlon Share Price Targets 2025 to 2050 – Is a Rally Coming? - May 30, 2025
  • Adani Power Share Price Target 2025 to 2050 – Will It Light Up Your Portfolio? - May 27, 2025

Post navigation

Previous Previous
Suzlon Share Price Targets 2025 to 2050 – Is a Rally Coming?

About

We are passionate about trading and investing in share market. We are here to provide you latest and reliable data & forecasts which can assist you in taking informed financial decisions. Furthermore, we want our users to get fine-tuned knowledge from our website & want them to get motivated towards financial freedom.

Rupee Rituals icon
Facebook FacebookTwitter XYouTube YouTubeInstagram InstagramTelegram TelegramThreads ThreadsPinterest Pinterest

     Copyright © 2026 Rupee Rituals

  • About Us
  • Contact us
  • Terms & Conditions
  • Privacy Policy
  • Disclaimer
  • हिन्दी
Scroll to top
  • हिन्दी
  • Price Targets
  • Calculators
  • About Us
  • Contact us
  • Terms & Conditions
  • Privacy Policy
  • Disclaimer