
Adani Power Share Price Target 2025 to 2050 – Will It Light Up Your Portfolio?
30 Seconds Summary
About Adani Power Limited (BSE, NSE : ADANIPOWER)
| Company Name | Adani Power Limited |
| Stock Exchange | NSE, BSE |
| Ticker Symbol | NSE : ADANIPOWER | BSE : 533096 |
| Headquarter | Ahmedabad, Gujarat |
| Sector | Energy (Renewable Energy) |
| Founded in | 1996 |
| Market Cap. | INR 2,15,583.60 Crore (₹ 2,15,583,600,0000) |
| Revenue | INR 58,905 Crore |
| Competitors / Peers | NTPC Ltd (NTPC), Power Grid Corporation (POWERGRID), Tata Power Company (TATAPOWER), JSW Energy (JSWENERGY), Torrent Power (TORRENTPOWER), Reliance Power (RPOWER), Waaree Renewable (WAAREENEER) |
| Listing date | BSE & NSE – August 20, 2009 |
| All-time high price | ₹ 895.85 (June 03, 2024) |
| All-time low price (since 2020) | ₹ 23.00 (March 13, 2020) |
Adani Power Share Price Analysis : SHORT & LONG TERM
Before getting into Adani Power share price targets, we will first analyze its technical chart and compare the its performance with major indices like NIFTY50 and Sensex. This section will cover a detailed long-term share price analysis and timeframe analysis of ADANIPOWER.
Chart analysis of ADANIPOWER Share Price
When we checked Adani Power’s chart, it looked like a roller-coaster ride. After COVID-19 hit, when the stock reached its lowest level of ₹23.00, Adani Power traded in sideways to uptrend till March 2022. On March 25, 2022 Adani Power broke its range and started to move up. From ₹140 it reached the level of ₹340 within two months. After hitting this high, there was heavy profit-booking done by the traders, who might have bought it during Covid crises and the stock reached the level of ₹238 losing almost ₹100 per share in just 20 days. This downward movement didn’t continued and Adani Power regained its strength & started moving up again till ₹432.50, we can see three gap-up openings also which shows the confidence of the traders / investors in the company. But this rally also met its end and the stock started to coming down.
Adani Power’s Key indicators, Comparative analysis with major indices and peer companies, Long term price analysis
NIFTY, SENSEX & Adani Power : A comparative analysis
Adani Power Limited is neither a part of NSE’s NIFTY index nor included in BSE’s SENSEX index and by observing the comparative chart above, we can clearly see NO correlation between ADANIPOWER & SENSEX. Below is the comparative table of NIFTY, SENSEX & ADANIPOWER returns based on CLOSING Prices.
| Year | Nifty | Sensex | ADANIPOWER |
|---|---|---|---|
| 2024 | +8.80% | +8.17% | +0.82% |
| 2023 | +20.03% | +18.74% | +75.31% |
| 2022 | +4.33% | +4.44% | +200.45% |
| 2021 | +24.12% | +21.99% | +100.20% |
| 2020 | +14.90% | +15.75% | -19.42% |
Here, we can observe that, in the year 2021, 2022 and 2023, Adani Power gave Massive returns to its investors even the overall market was slightly on the positive side.
Adani Power Limited : Long term price analysis
From the given table we can observe that in the previous 5 years, ADANIPOWER shares gave HUGE returns to its investors from 2021 till 2024. These percent changes are based on the HIGHEST price (TARGET) of the year basis.
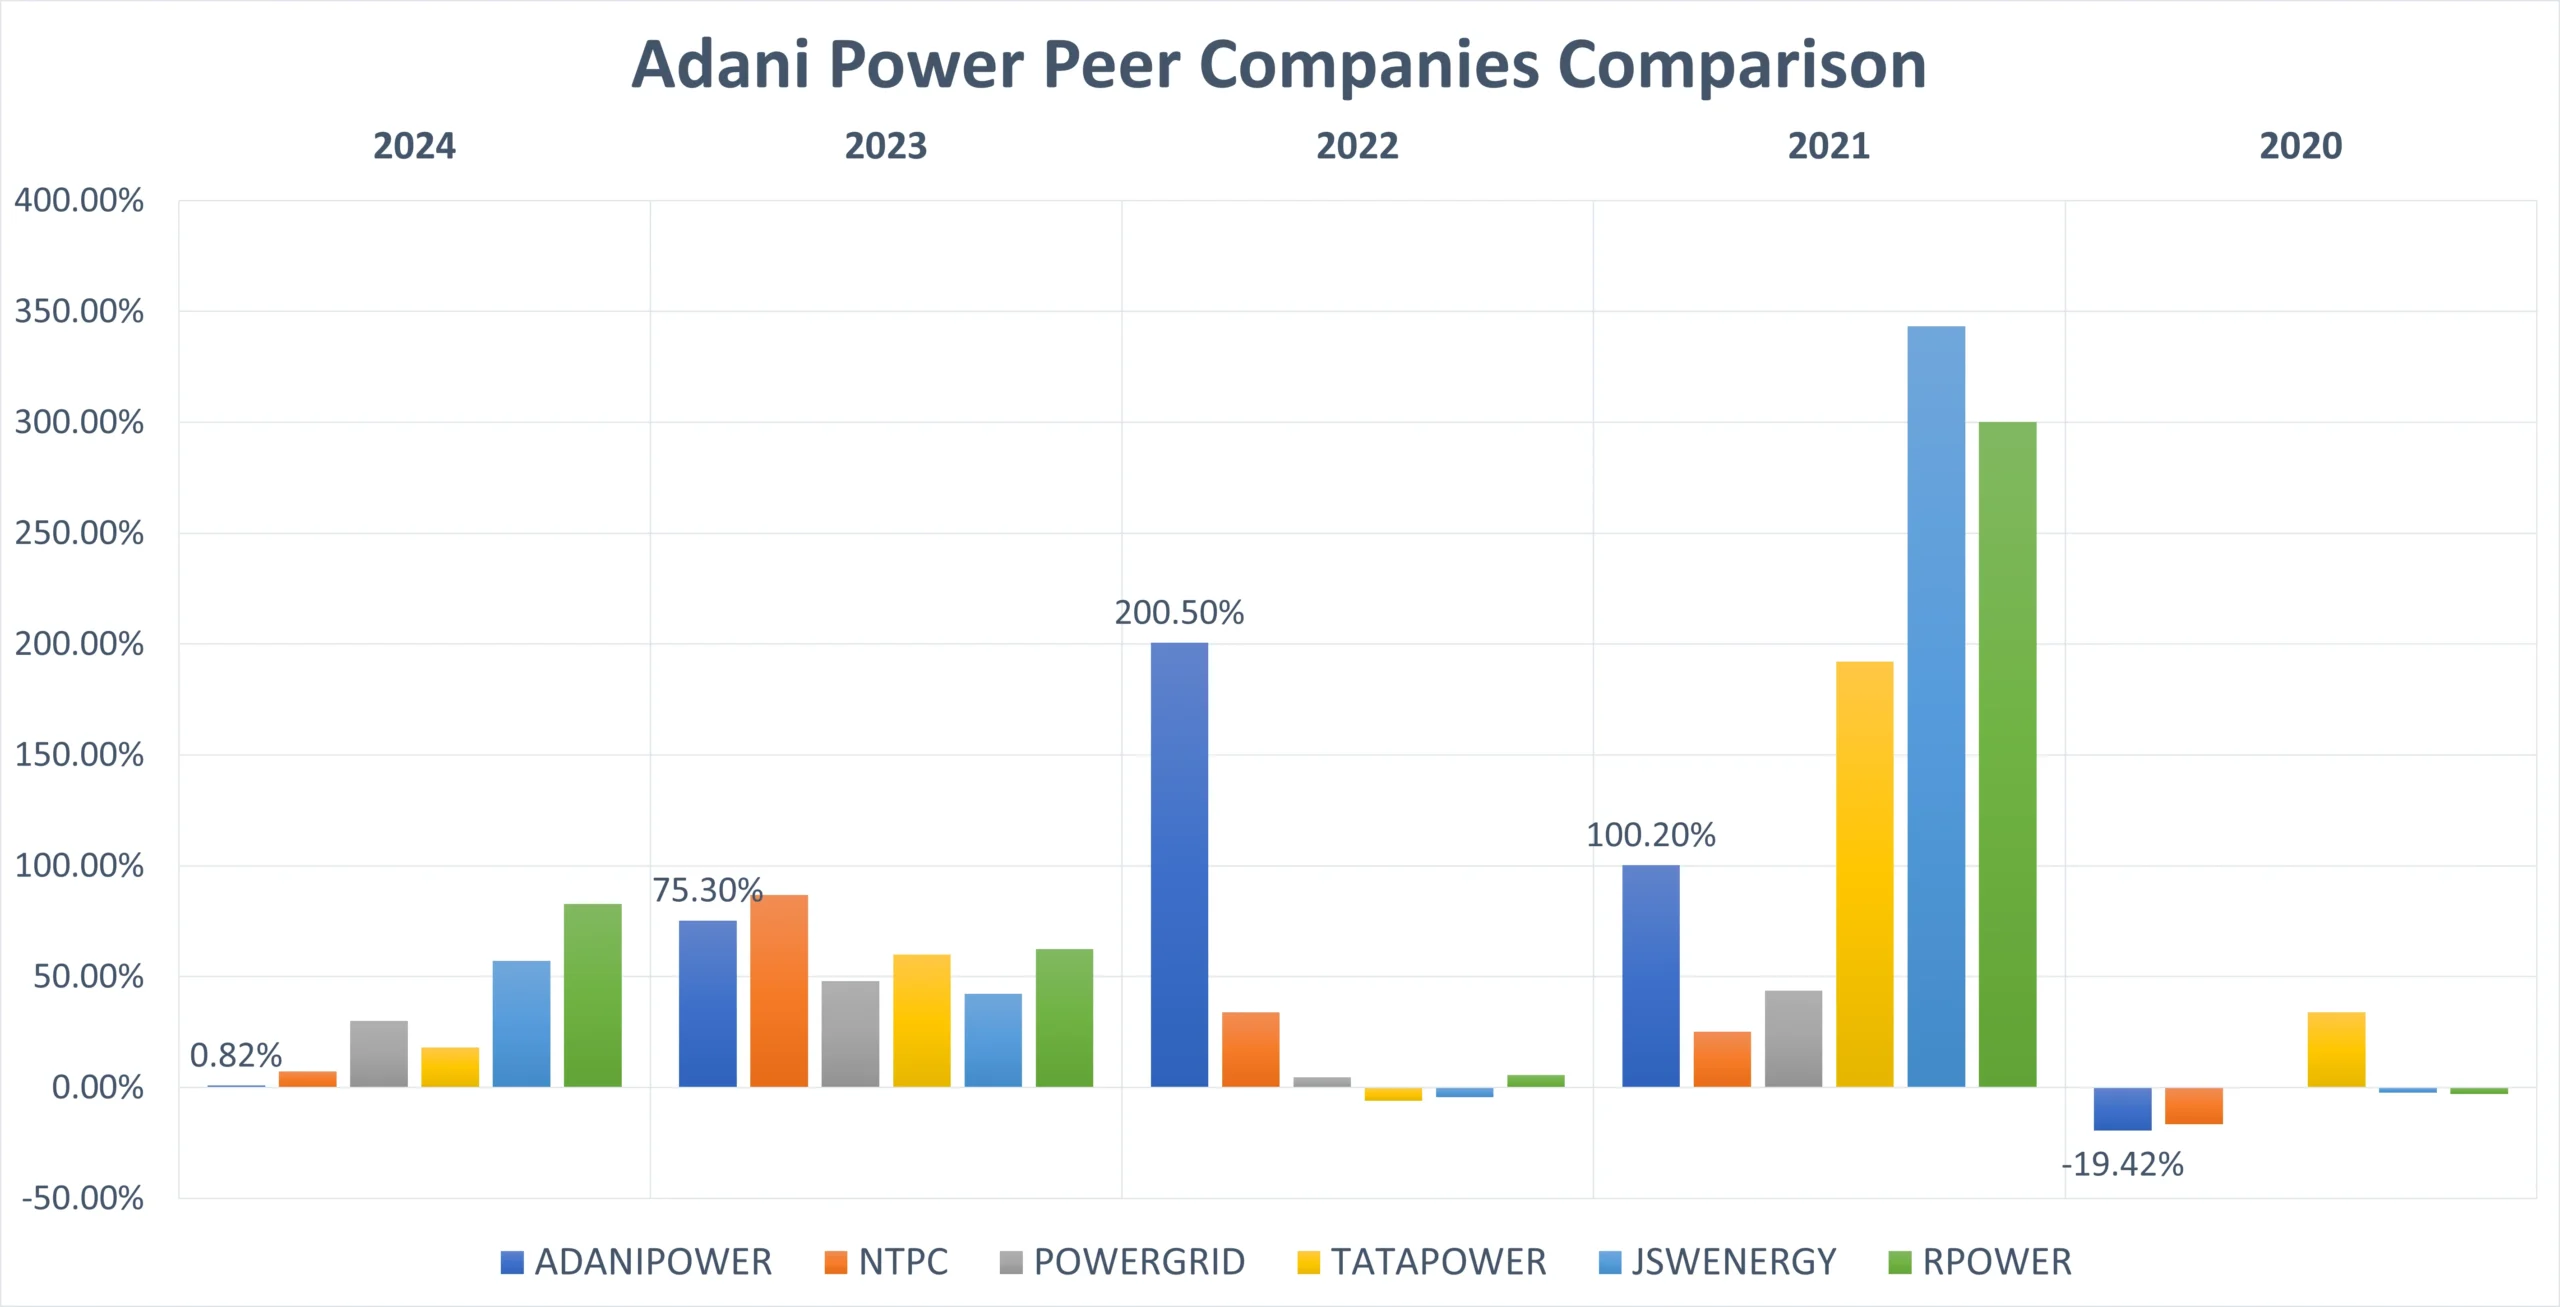
Adani Power Ltd. Peer Comparison / Competitors analysis
Since Waaree Renewable (WAAREENEER) got listed in 2024, we are not considering it for this analysis, but if you are interested in it, you can checkout our other post. Adani Power gave massive average returns of 71.50% to its investors. Year 2021, 2022 and 2023 can be termed as golden year for Adani Power. In these three years, Adani Power’s share price rose by 375%. Although the average power sector growth can be estimated up to 50%, but Adani Power outperformed that too.
Adani Power Limited (BSE, NSE : ADANIPOWER) Key Indicator Values
Time-Frame analysis of Adani Power : Daily, Weekly & Monthly
As by a simple timeframe chart analysis we can observe the following about ADANIPOWER share price which will help us more in reaching our final outcome i.e. Adani Power share price targets-
| Time Frame | Observation |
|---|---|
 View Daily Chart (Every candle represents NSE : ADANIPOWER share’s trading session of one day. Each single candle represent the HIGH, LOW, OPEN, CLOSE of that particular day) | On daily time-frame, we can observe that Adani Power share price is trading ABOVE all the 21 Day, 50 Day & 100 Day SMAs but slightly BELOW the 200 Day SMA. This is the indicator of weak BULLISH trend for medium term. |
 View Weekly Chart (Every candle represents NSE : ADANIPOWER stock’s trading session of one week. Each single candle represent the HIGH, LOW, OPEN, CLOSE of that particular week) | On the weekly time-frame, we can observe that Adani Power share price is trading ABOVE all the 21 week, 100 week & 200 week SMAs but slightly BELOW the 50 week SMA. This is the indicator of weak BULLISH trend for Long term. Check the Support & Resistance zone we have marked in the image. |
 View Monthly Chart (Every candle represents NSE : ADANIPOWER stock’s trading session of one month. Each single candle represent the HIGH, LOW, OPEN, CLOSE of that particular month) | On the monthly time-frame, we can observe that Adani Power share price is trading ABOVE all the 50 month & 100 month SMAs but slightly ABOVE the 21 month SMA. This is the indicator of weak BULLISH trend for Very long term. |
Adani Power Share Price Target : SHORT & LONG TERM
Adani Power Share Price Target 2025, 2026, 2027, 2028, 2029
- In 2026, the stock might climb to ₹720.05, reflecting a 35.99% increase compared to the 2024 level.
- By 2027, Adani Power shares could rise to around ₹835.25, marking a solid 57.75% return from the 2024 closing price.
- In 2028, the upward trend may continue, taking the stock to ₹905.15, showing a 71.00% growth over 2024.
- Looking at 2029, Adani Power could potentially touch ₹1,064.90, delivering an impressive 101.20% return from the 2024 closing value of ₹529.45.
Adani Power Share Price Target 2030, 2035, 2040, 2045, 2050
- By 2030, Adani Power’s share price is estimated to touch ₹1,224.65, offering an impressive 131.34% return from its 2024 closing price of ₹529.45.
- By 2035, the stock could climb to ₹2,463.10, delivering a significant 365.13% gain compared to the 2024 levels.
- Moving forward to 2040, Adani Power’s share value may rise to ₹4,954.40, marking a massive 835.69% increase over its 2024 closing price.
- In 2045, the stock could reach around ₹9,965.05, reflecting a substantial 1,782.12% surge from the 2024 value.
- Looking even further ahead, by 2050, Adani Power’s share could potentially soar to ₹20,043.20, indicating a phenomenal 3,686.86% growth from its 2024 price of ₹529.45.
These projections are provided without considering any kind of share split. They can be viewed as long-term share price targets based on the current valuation of Adani Power Ltd. (ADANIPOWER) as of 2025.
Adani Power Share Price Target 2025 (month-wise)
Also Read : Discover Where IndusInd Bank Shares Could Reach – Detailed Forecast & Analysis Inside!
Adani Power Share Price Target 2026 (month-wise)
Adani Power Share Price Target 2027 (month-wise)
Also Read : How much Hindustan Aeronautics Ltd. (HAL) can fly in upcoming days? Let’s find out…
Conclusion
Don’t forget to check out our FAQs, you may find the answer of your query. Please rate this post if you like it, suggestions are always welcomed. 🤑HAPPY INVESTING🤑
Frequently Asked Questions (FAQs)
1) Is ADANIPOWER a good share to buy?
Yes, Adani Power (BSE, NSE : ADANIPOWER) can be a good share to buy for long-term investors. With a strong legacy since 1996, a market cap of ₹2.15 lakh crore, and impressive 5-year average returns of 71.5%, the company shows solid growth potential. While market risks remain, Adani Power’s position in the energy sector and consistent performance make it a promising option for long-term investment.
2) What is the Adani Power share price target for 2025?
₹608.85 is the Adani Power share price target 2025 representing a 15.01% gain over the 2024 closing price of ₹529.45
3) What is the Adani Power share price target for 2050?
By 2050, the Adani Power share price target could be around ₹20,043.20 (without considering any split).
4) What is the Adani Power share price target for 2040?
By 2040, the Adani Power share price target could be around ₹4,954.40 (without considering any split).
5) What is the Adani Power share price target for 2030?
As per our analysis, Adani Power share price target can be a high of ₹1224.65 in 2030.
6) What can be the Adani Power share price target today / tomorrow?
Since ADANIPOWER share’s average daily move is around +/- 1.50%. We can estimate +1.50% or -1.50% of previous day’s close for Adani Power share price target today / tomorrow.
Also Read :👉 Bajaj Housing Finance Share Price Forecast 2025–2050: Is It the Next Multi-bagger
Disclaimer : Not an Investment Advice
The content shared in the article “Adani Power Share Price Target 2025 to 2050 – Will It Light Up Your Portfolio?” is for general information only. It’s not intended as financial, investment, or professional advice. Always consult a qualified professional—whether legal, financial, or tax-related—before making any investment decisions.
