
M&M Share Price Target Tomorrow, 2025 to 2030, 2040, 2050 (BSE : M_M, NSE : M&M)
30 Seconds Summary
About Mahindra & Mahindra Limited (BSE : M_M, NSE : M&M)
| Company Name | Mahindra & Mahindra Limited |
| Industry | Automobiles |
| Stock Exchange | NSE, BSE |
| Ticker Symbol | NSE : M&M | BSE : 500520, M_M |
| Headquarter | Mumbai, Maharashtra |
| Founded in | 1945 |
| Market Cap. | INR 3.65 Trillion (₹ 3,647,891,800,000) |
| Revenue(2024) | INR 139,078 Crore |
| Competitors / Peers | Maruti Suzuki India(MARUTI), Tata Motors Ltd. (TATAMOTORS), Force Motors Ltd. (FORCEMOT), Hyundai Motors India (HYUNDAI) |
| Listing date | BSE & NSE – January 03, 1996 |
| All-time high price | 3237.05 (Jan 03, 2025) |
| 52-week high | 3237.05 (Jan 03, 2025) |
| 52-week low | 1609.05 (Jan 31, 2024) |
M&M Share Price Analysis : SHORT & LONG TERM
Chart analysis of M&M Share Price
In one year Mahindra & Mahindra share price chart, we can notice that on its First trading day of 2024 (Jan 01, 2024) it OPENED its year at the price of ₹1729.40 & now in the end of the First Month of the year 2025, it is trading on ₹2924.35 (Jan 29, 2025) showing a positive return of +69.09%. It looks like the great year for M&M. In Five months starting from mid-February to June, M&M skyrocketed in the upward direction (with some minor corrections) & reached at ₹2946 from ₹1660. But from mid-June till January 2025, M&M share price is trading in a range of ₹2650 to ₹3220. M&M closed its year 2024 at the price of ₹3006.95 giving huge returns to its patient investors.
NIFTY, SENSEX & M&M : A comparative analysis
Mahindra & Mahindra Limited ( BSE : M_M, NSE : M&M) is included in both the NSE’s NIFTY index and the BSE’s SENSEX index, making it one of the key companies of Automobile sector in these benchmarks. Observing the comparative chart above, it is clear that M&M’s performance sometimes aligns with that of the SENSEX but sometimes it trades in its own way depending on the demand of vehicles. Below is a comparative table showcasing the 5-year returns of NIFTY, SENSEX, and M&M based on their closing prices –
| Year | Nifty | Sensex | M&M |
|---|---|---|---|
| 🟢 2024 | +8.80% | +8.17% | +74.20% |
| 🟢 2023 | +20.03% | +18.74% | +38.17% |
| 🟢 2022 | +4.33% | +4.44% | +49.21% |
| 🟢 2021 | +24.12% | +21.99% | +16.23% |
| 🟢 2020 | +14.90% | +15.75% | +35.55% |
During 2024, M&M gave a MASSIVE return of +74.20% & before that also It always gave positive investment outcomes to the investors. In 2020, 2022, 2023 & 2024, M&M outperformed both the indices with a decent margin.
M&M Peer Comparison / Competitors analysis
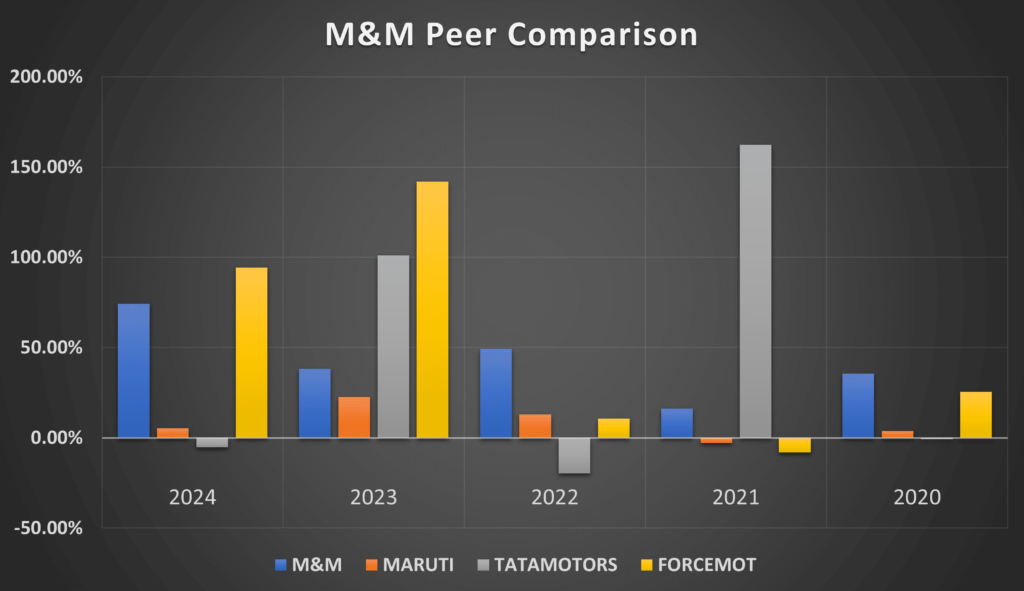
We will compare Mahindra & Mahindra (M&M) to its top competitors. We will see how its peer companies performed year-on-year . Below is the comparative table of Maruti Suzuki India(MARUTI), Tata Motors Ltd. (TATAMOTORS), Force Motors Ltd. (FORCEMOT)’s returns from 2020 to 2024 based on CLOSING Prices.
| Year | M&M | MARUTI | TATAMOTORS | FORCEMOT |
|---|---|---|---|---|
| 2024 | +74.2% | +5.4% | -5.1% | +94.3% |
| 2023 | +38.2% | +22.7% | +101.0% | +141.9% |
| 2022 | +49.2% | +13.0% | -19.6% | +10.8% |
| 2021 | +16.2% | -2.9% | +162.4% | -8.1% |
| 2020 | +35.5% | +3.8% | -0.7% | +25.5% |
| Average Returns | +42.6% | +8.4% | +47.6% | +52.9% |
Here we can observe that M&M Ltd. performance is par to its peer companies if we look at the 5-year average returns. Other companies also gave similar returns to their investor by which we can conclude that if you are investing in a Automobile sector company, you can expect a return of +40~48% average returns in long run. Since Hyundai Motors India is a newly listed entity, we are not including it in the above comparative table.
M&M Share Price Long term analysis
From the given table we can observe that in the previous 5 years, Mahindra & Mahindra (BSE:M_M, NSE:M&M) shares gave OKish returns to its investors from 2021 to 2024. These percent changes are based on the HIGH price (TARGET) basis.
Time-Frame analysis of M&M : Hourly, Daily & Weekly
By analyzing a M&M share price through a timeframe chart, we can gather some key insights that will assist us in determining the final M&M share price targets : –
| Time Frame | Observation |
|---|---|
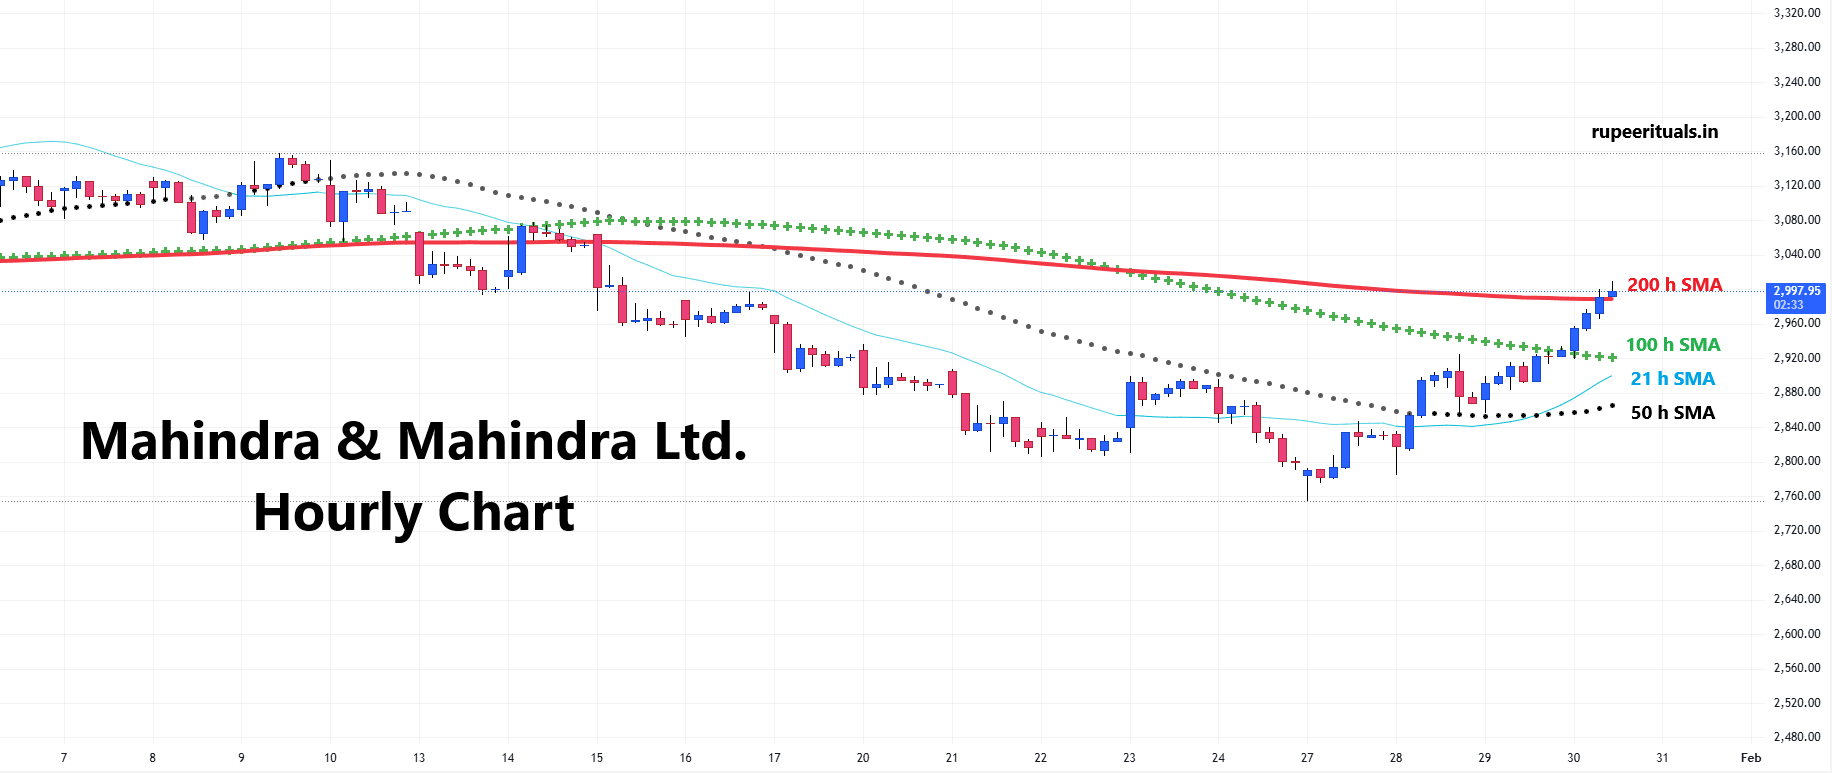 View Hourly Chart (Every candle represents NSE : M&M share’s trading session of one hour. Each single candle represent the HIGH, LOW, OPEN, CLOSE of that particular hour) | On hourly time-frame, we can observe that M&M share is trading above the 21 hour SMA & 50 hour but below the 100 hour and 200 hour SMA. This indicates that the Mahindra & Mahindra share price is in a slight Bullish trend for short term. |
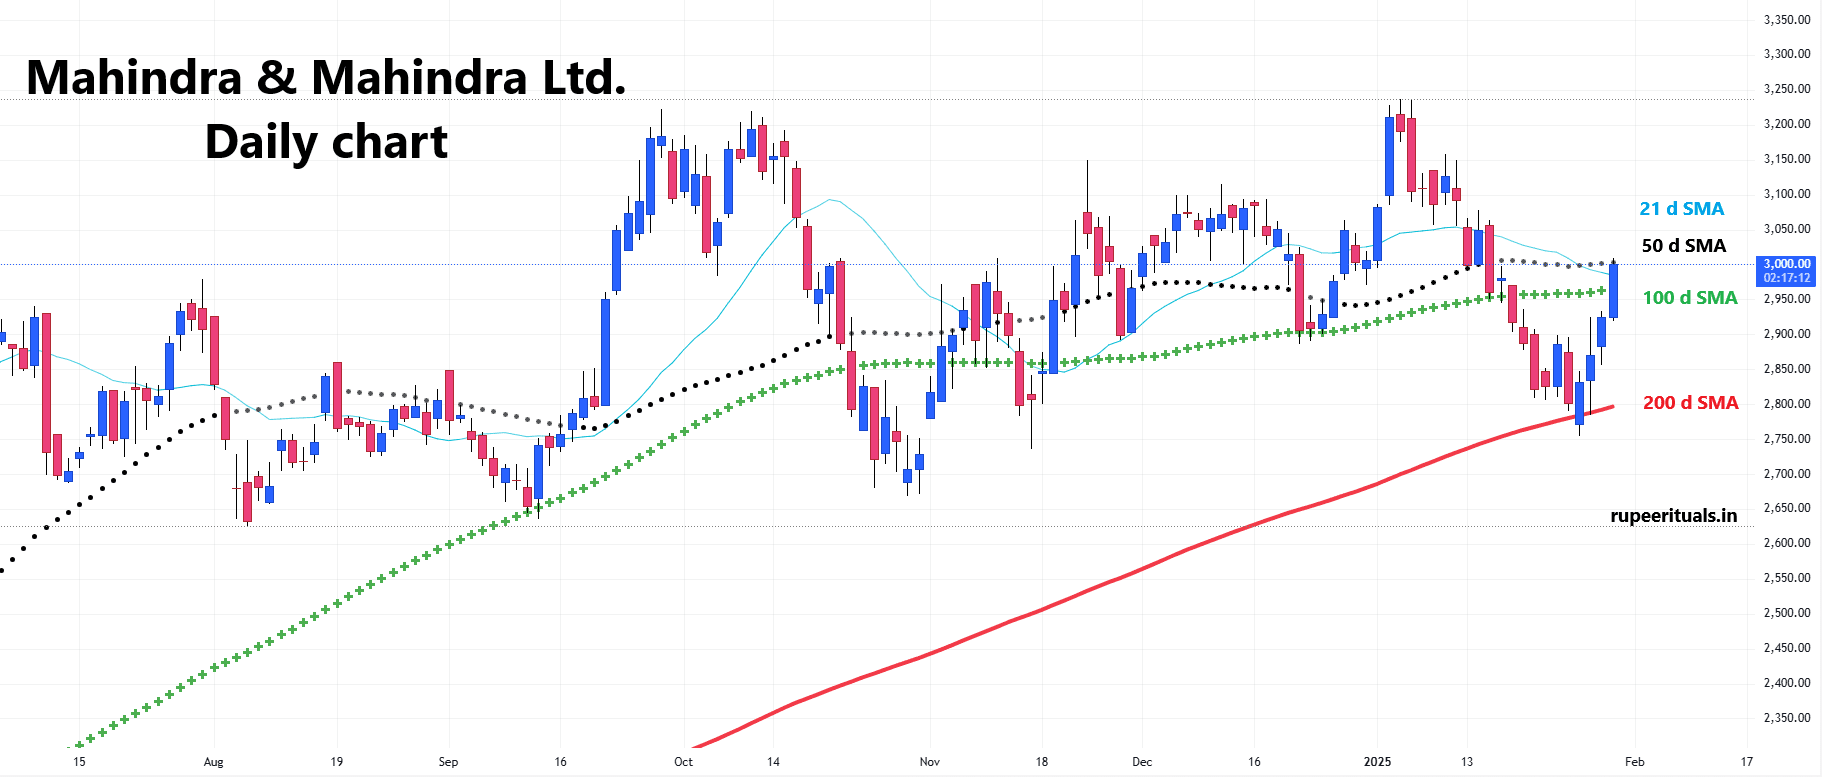 View Daily Chart (Every candle represents NSE : M&M share’s trading session of one day. Each single candle represent the HIGH, LOW, OPEN, CLOSE of that particular day) | On daily time-frame, we can observe that M&M share is trading BELOW 21 Day, 50 Day & 100 Day SMAs but above 200 Day SMA. This is the clear sign of a Bearishness in medium term. |
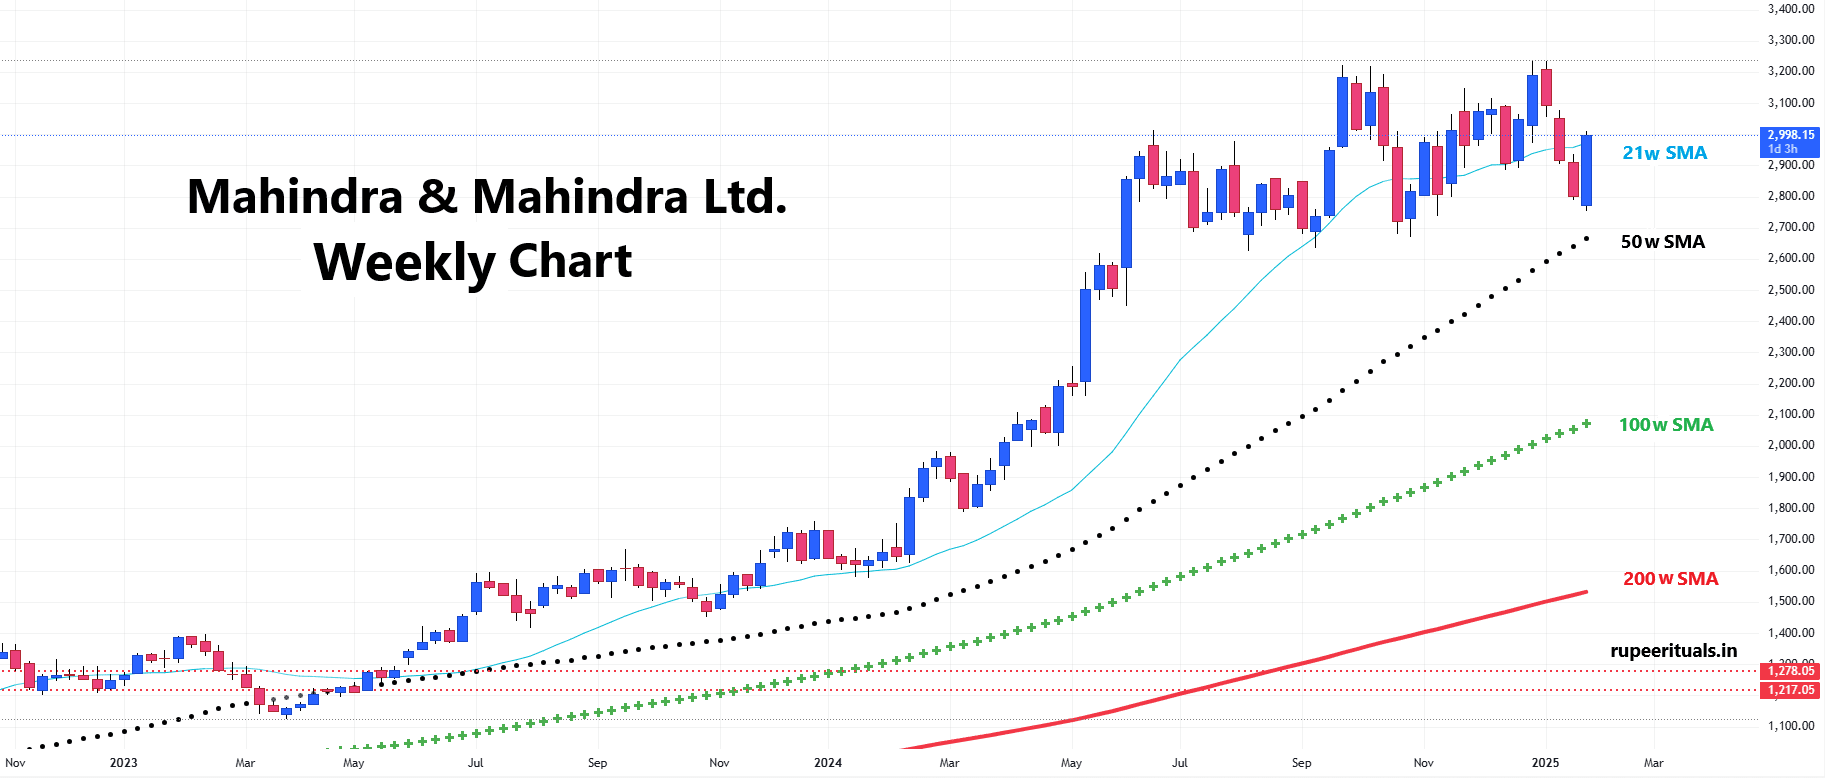 View Weekly Chart (Every candle represents NSE : M&M stock’s trading session of one week. Each single candle represent the HIGH, LOW, OPEN, CLOSE of that particular week) | On the weekly time-frame M&M share is trading above 21 weeks, 50 weeks 100 weeks & 200 weeks SMA . This indicates that Mahindra & Mahindra share has a Bullish sentiment, if we look at it from a very long term perspective. |
Mahindra & Mahindra (BSE : M_M, NSE : M&M) Key Indicator Values
M&M Share Price Target : SHORT & LONG TERM
M&M Share Price Target 2025, 2026, 2027, 2028, 2029
- By 2026, the stock could rise further to ₹4,149, representing a +37.98% gain.
- By 2027, the share price is projected to climb to ₹4,980, marking a +65.62% increase.
- By 2028, the price might continue its growth, reaching ₹5,975, showing a +98.71% growth.
- By 2029, M&M’s share value could hit ₹7,170, representing a +138.45% gain from its 2024 closing price
M&M Share Price Target 2030, 2035, 2040, 2045, 2050
- By 2040, M&M’s share value is expected to rise to ₹22,318, marking a +642.21% increase from its 2024 closing price.
- By 2045, M&M’s share price is expected to reach ₹35,945, marking a +1,095.40% increase from its 2024 closing price.
- By 2050, looking even further, the share price could soar to ₹57,888, indicating an incredible +1,825.14% growth.
These projections are made without factoring in any potential share splits. They represent the estimated share price targets based on the current overall value of Mahindra & Mahindra Ltd. (BSE: M_M, NSE: M&M) shares.
🧑💻Is Adani Enterprises a profitable investment for your portfolio in 2025 ? Read this to find out…
M&M Share Price Target for 2025 (month-wise)
M&M Share Price Target for 2026 (month-wise)
As per our analysis of M&M share price target 2026, we are expecting that the prices may rise up to ₹4149 by 2026, offering an approximate +37.98% return on its 2024’s closing price of ₹3006.95.
M&M Share Price Target for 2027 (month-wise)
As per our analysis of M&M share price target 2027, we are expecting that the prices may rise up to ₹4980, offering an approximate +65.62% return on its 2024’s closing price of ₹3006.95.
👷🏾♂️ Can Ambuja Cements give strength to your portfolio in 2025? Read this to find out…
Conclusion
Be sure to check out our FAQ section for answers to any questions you may have. We’d love to hear your feedback, so don’t hesitate to rate this post and share your thoughts! 🤑 Happy Investing! 🤑
Frequently Asked Questions (FAQs)
1) Is M&M a good buy?
As per our analysis, we recommend Mahindra & Mahindra Ltd. (BSE : M_M, NSE : M&M) as a DECENT BUY for an investor if you are willing to invest in Automobile sector. Since e-vehicle demand is growing & M&M is innovating new EV models, we can see rise in demand of its share also in near future.
2) What is the M&M share price target 2025?
₹3458 per share is the M&M share price target for 2025 which is a +15.00% return on 2024’s closing price of ₹3006.95, as per our analysis.
3) What is the M&M share price target 2050?
By 2050, the M&M share price target could be around ₹57,888 (without considering any split).
4) What is the M&M share price target 2040?
As per our analysis, ₹22,318 (without considering any split) is the M&M share price target for 2040 which is ~640% return on 2024’s closing price of ₹3006.95.
5) What is the M&M share price target 2030?
As per our analysis, M&M share target can be a high of ₹8604 in 2030.
6) What can be the M&M share price target tomorrow?
Since M&M share’s average daily move is around +/- 1.10%. We can estimate +1.10% or -1.10% of previous day’s close for M&M share price target tomorrow.
7) What can be the M&M share price target next week?
Since M&M share’s average weekly move is around +/- 3.50%. We can estimate +3.50% or -3.50% of previous week’s close for M&M share price target next week.
📈 EaseMyTrip can be a sponsor to you next trip, if you invest in it for long term. Read this to find out how..
Disclaimer : Not an Investment Advice
The content shared in the article “M&M Share Price Target Tomorrow, 2025 to 2030, 2040, 2050 (BSE : M_M, NSE : M&M)” is for general information only. It’s not intended as financial, investment, or professional advice. Always consult a qualified professional—whether legal, financial, or tax-related—before making any investment decisions.
