ONGC Share Price Target Tomorrow, 2025 to 2030, 2040, 2050
🕰️30 Seconds Summary🕰️
About Oil & Natural Gas Corp. (BSE, NSE : ONGC)
| Company Name | Oil & Natural Gas Corporation Limited |
| Stock Exchange | NSE, BSE |
| Ticker Symbol | NSE : ONGC | BSE : 500312, ONGC |
| Headquarter | Delhi, India |
| Founded in | 1956 |
| Market Cap. | INR 3.34 Trillion (₹ 3,343,838,200,000) |
| Revenue(2024) | INR 655,259 Crore |
| Competitors / Peers | Oil India Ltd. (OIL), Hindustan Oil Exploration Company (HINDOILEXP), Aban Offshore Ltd. (ABAN), Asian Energy Services Ltd. (ASIANENE) |
| Listing date | BSE & NSE – July 19, 1995 |
| All-time high price | 345.00 (August 13, 2024) |
| 52-week high | 345.00 (August 13, 2024) |
| 52-week low | 223.00 (June 04, 2024) |
ONGC Share Price Analysis : SHORT & LONG TERM
Before exploring about ONGC share price targets, we will begin by analyzing its technical chart and evaluating the company’s performance in comparison to major indices such as NSE’s NIFTY50 and BSE’s Sensex. Additionally, this section will provide an in-depth long-term price analysis and a multi-timeframe review of ONGC’s stock.
Chart analysis of ONGC Share Price
NIFTY, SENSEX & ONGC : A comparative analysis
Oil & Natural Gas Corporation Limited ( BSE, NSE : ONGC) is included in both the NSE’s NIFTY index and the BSE’s SENSEX index, making it one of the key companies in these benchmarks. Observing the comparative chart above, it is clear that ONGC’s performance closely aligns with that of the SENSEX. Below is a comparative table showcasing the 5-year returns of NIFTY, SENSEX, and ONGC based on their closing prices.
| Year | Nifty | Sensex | ONGC |
|---|---|---|---|
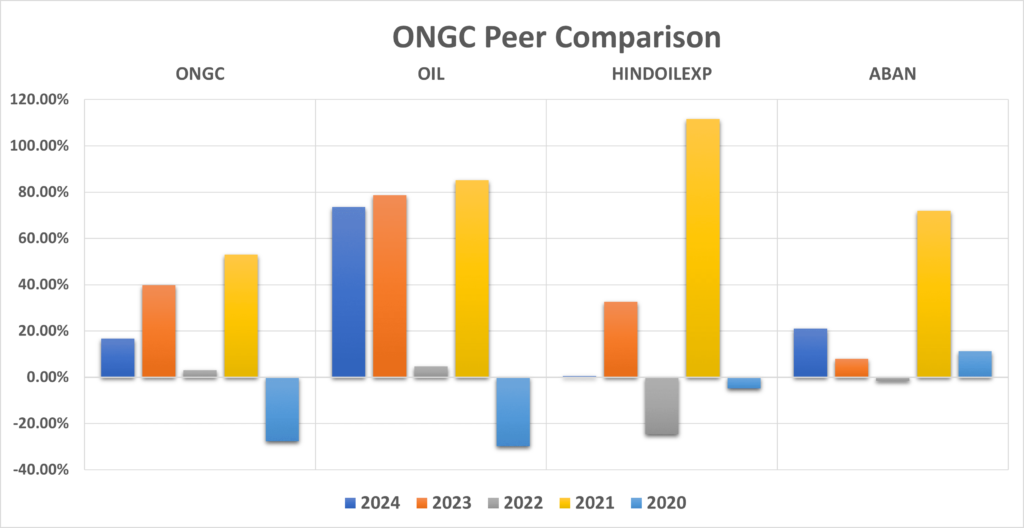
| 🟢 2024 | +8.80% | +8.17% | +16.68% |
| 🟢 2023 | +20.03% | +18.74% | +39.73% |
| 🟢 2022 | +4.33% | +4.44% | +3.05% |
| 🟢 2021 | +24.12% | +21.99% | +53.04% |
| 🔴 2020 | +14.90% | +15.75% | -27.76% |
During 2020, ONGC gave a negative return of -27.76% but after that, It gave positive investment outcomes to the investors till 2024. In 2021, 2023 & 2024, ONGC outperformed both the indices with a decent margin. Keep reading, below we have got the peer comparison analysis for you.
ONGC Peer Comparison / Competitors analysis
Here we can observe that ONGC Ltd. performance is not par to its peer companies if we look at the 5-year average returns. Since , Asian Energy Services Ltd. (ASIANENE) got listed during 2021, we are not comparing it with other peer companies.
ONGC Share Price Long term analysis
From the given table we can observe that in the previous 5 years, ONGC shares gave DECENT returns to its investors from 2021 till 2024. These percent changes are based on the HIGH price (TARGET) basis.
If we take average inflation rate of 6% per annum into account, it can still be considered as OKish returns (ROI) almost ~68% in 5 years. Now we know about the historical price change, its time to dive into how ONGC share might behave in coming days. Let’s analyze it on different timeframes.
Time-Frame analysis of ONGC : Hourly, Daily & Weekly
By analyzing ONGC’s share price through a basic timeframe chart, we can gather key insights that will assist us in determining the final ONGC share price targets : –
| Time Frame | Observation |
|---|---|
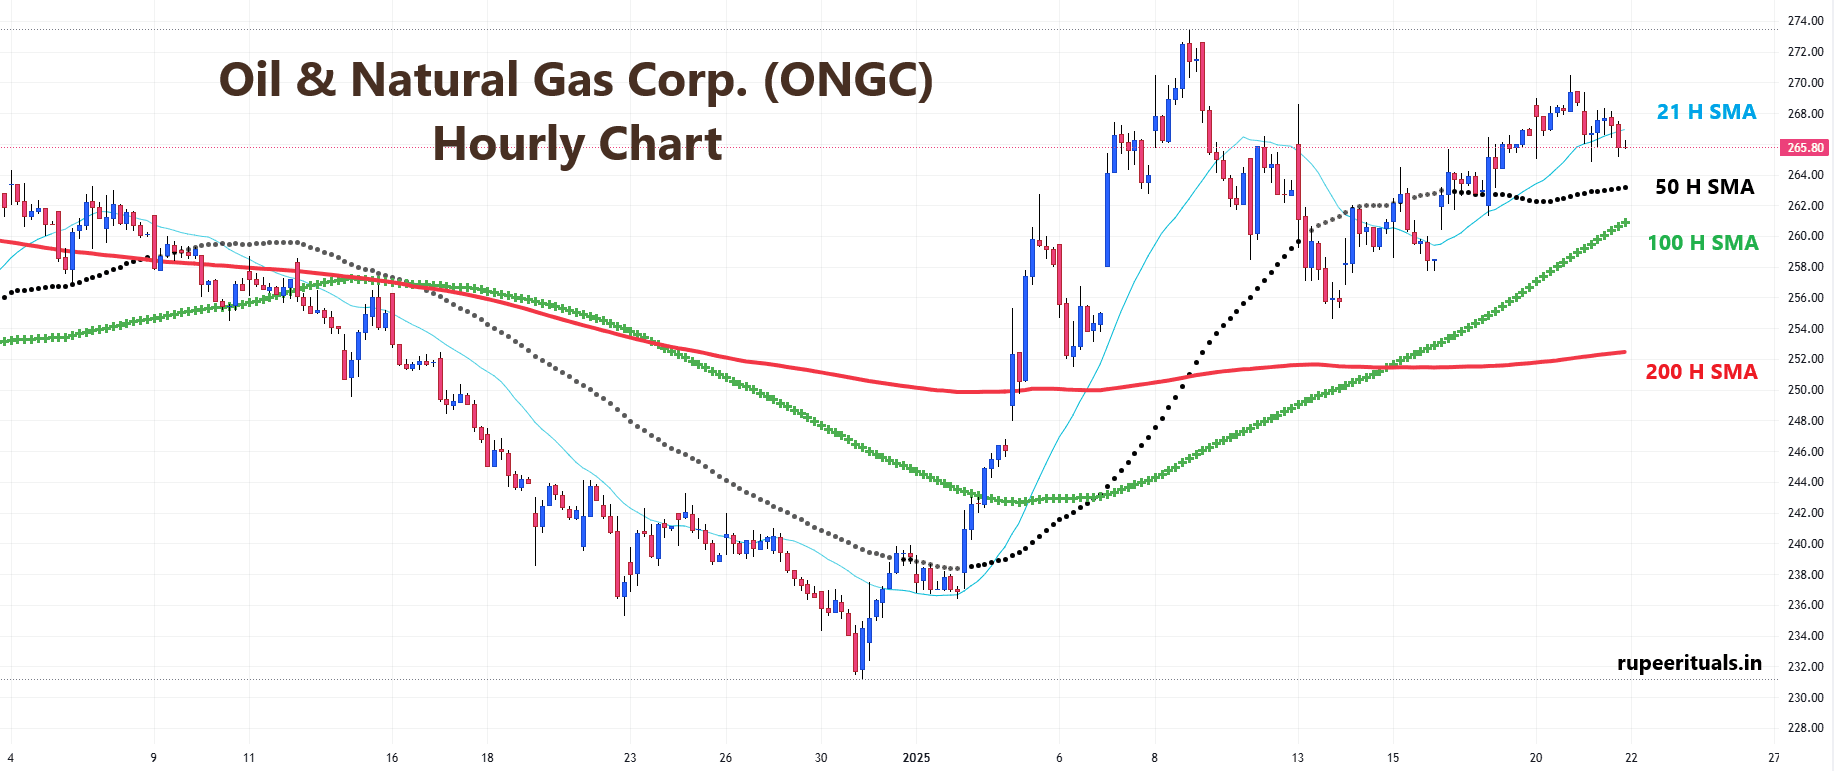 View Hourly Chart (Every candle represents NSE : ONGC share’s trading session of one hour. Each single candle represent the HIGH, LOW, OPEN, CLOSE of that particular hour) | On hourly time-frame, we can observe that ONGC share is trading above the 21 hour SMA,50 hour, 100 hour and 200 hour SMA. This indicates that the ONGC share price is in a slight Bullish trend for short term. |
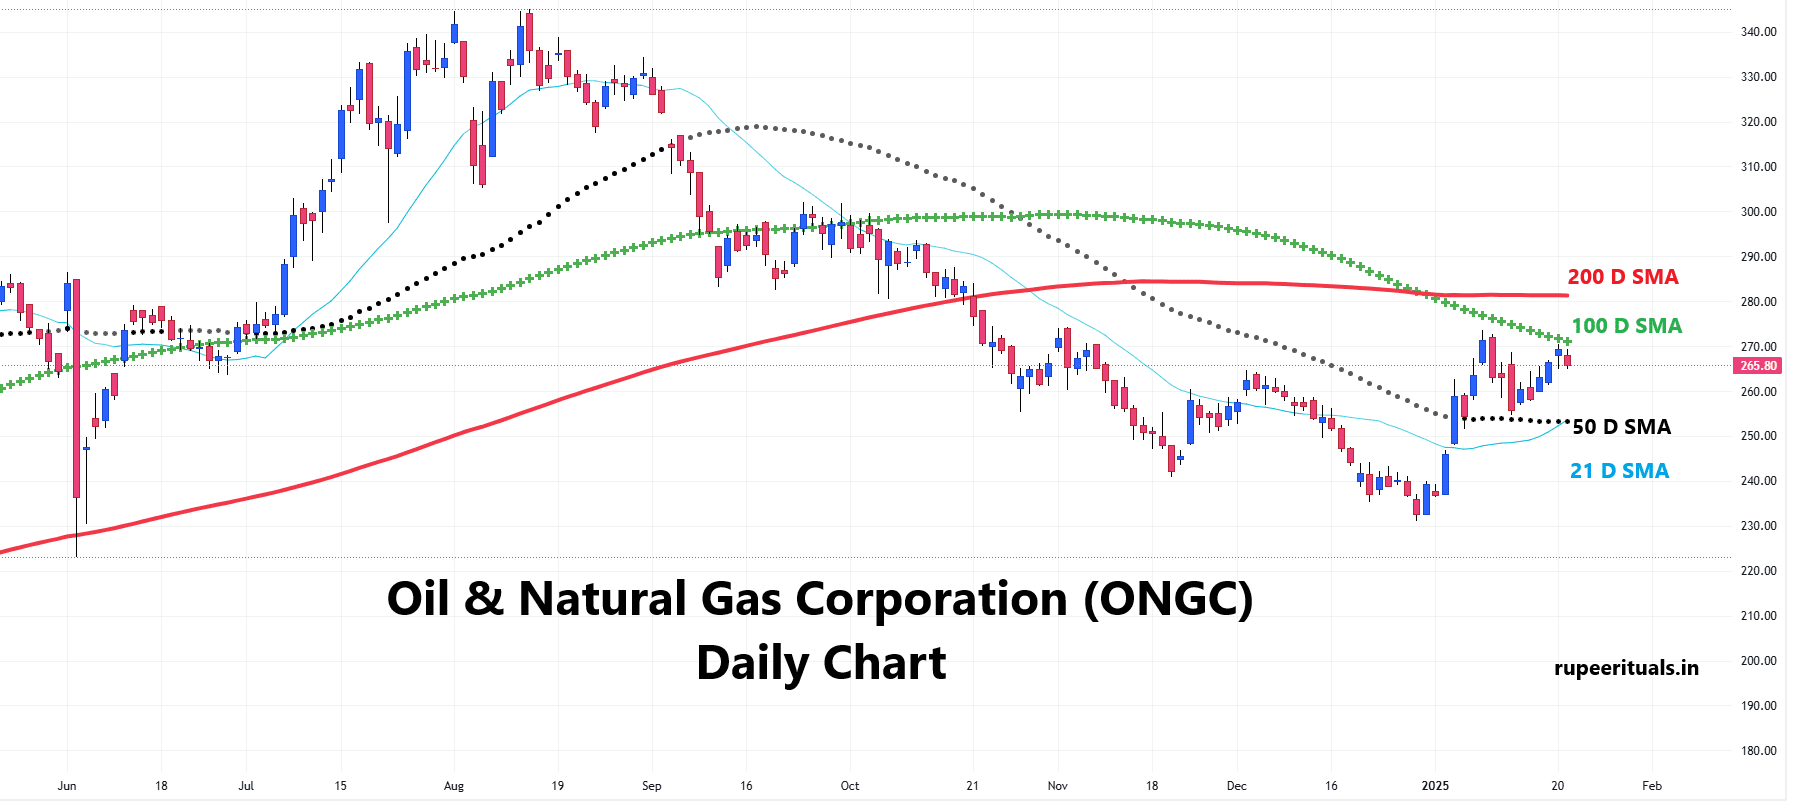 View Daily Chart (Every candle represents NSE : ONGC share’s trading session of one day. Each single candle represent the HIGH, LOW, OPEN, CLOSE of that particular day) | On daily time-frame, we can observe that ONGC share is trading BELOW 100 Day and 200 Day SMAs BUT above 21 Day, 50 Day, SMAs. This is the sign given by a stock when it tries to change its direction from Bearish trend to Sideways to Bullish for medium term. |
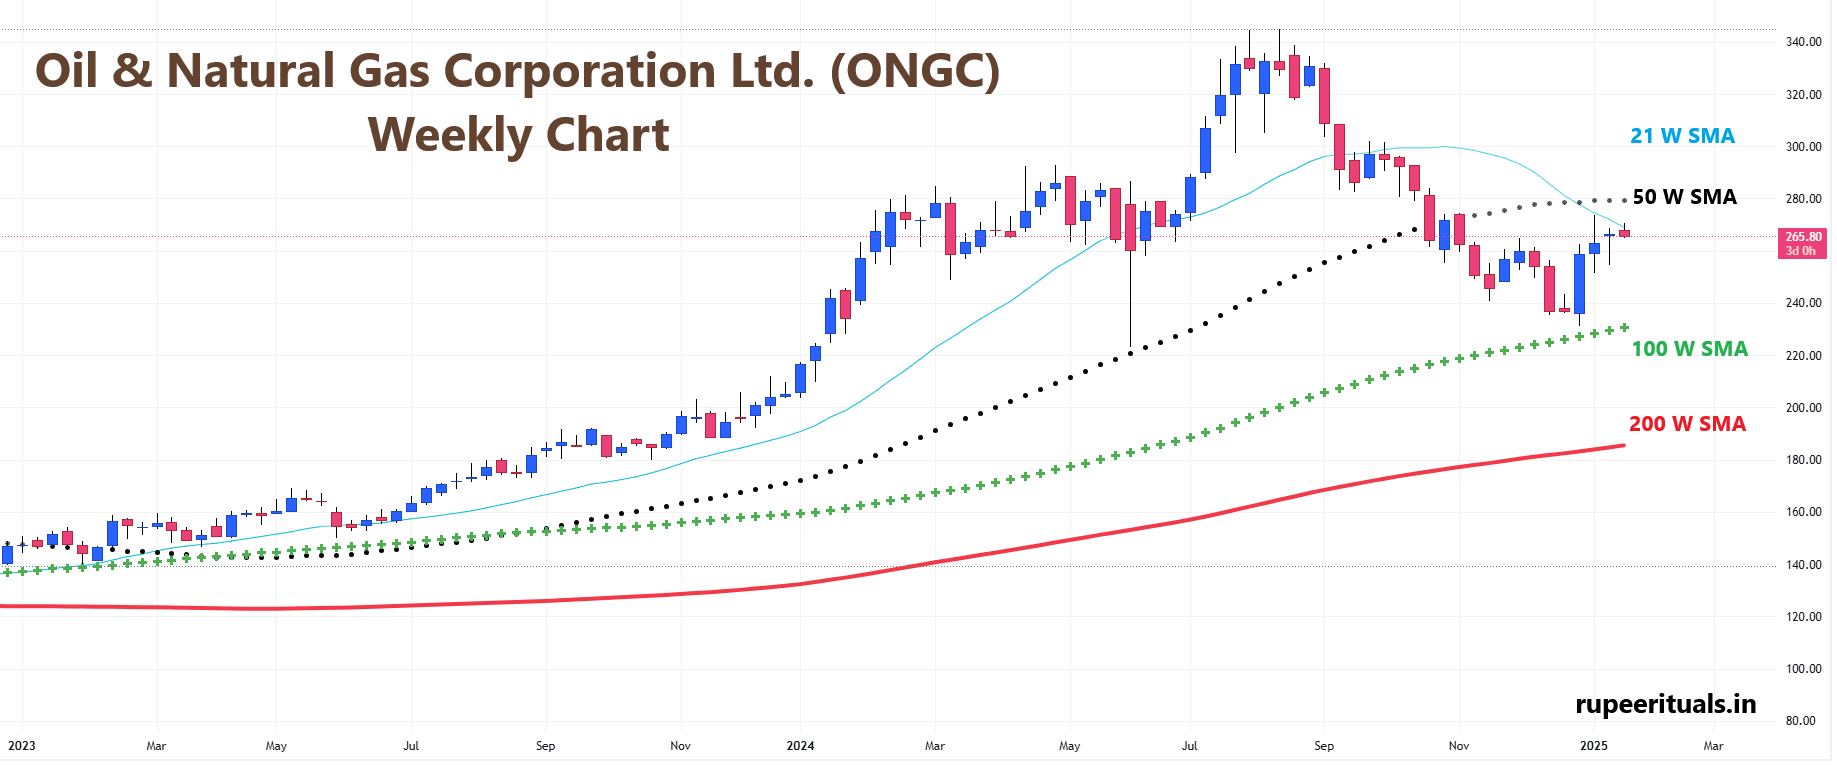 View Weekly Chart (Every candle represents NSE : ONGC stock’s trading session of one week. Each single candle represent the HIGH, LOW, OPEN, CLOSE of that particular week) | On the weekly time-frame ONGC share is trading above 100 weeks & 200 weeks SMA BUT below 21 weeks, 50 weeks SMA . This indicates that ONGC share has a mixed sentiment, if we look at it from a very long term perspective. |
Oil & Natural Gas Ltd. (BSE, NSE : ONGC) Key Indicator Values
ONGC Share Price Target : SHORT & LONG TERM
ONGC Share Price Target 2025, 2026, 2027, 2028, 2029
- By 2026, the stock could rise further to ₹385, representing a +60.91% gain.
- By 2027, the share price is projected to climb to ₹482, marking a +101.46% increase.
- By 2028, the price might continue its growth, reaching ₹607, showing a +153.74% growth.
- By 2029, ONGC’s share value could hit ₹751, representing a +213.97% gain from its 2024 closing price.
ONGC Share Price Target 2030, 2035, 2040, 2050
- By 2035, the stock could climb to ₹2,245, representing a +838.64% gain.
- By 2040, ONGC’s share value is expected to rise to ₹5,580, marking a +2,233.31% increase from its 2024 closing price.
- By 2050, looking even further, the share price could soar to ₹28,820, indicating an incredible +12,048.23% growth.
These projections are made without factoring in any potential share splits. They represent the estimated share price targets based on the current overall value of Oil & Natural Gas Corporation Ltd. (ONGC) shares..
🧑💻Can INFOSYS become the next major update in your portfolio in 2025 ? Read this to find out…
ONGC Share Price Target for 2025 (month-wise)
ONGC Share Price Target for 2026 (month-wise)
As per our analysis of ONGC share price target 2026, we are expecting that the prices may rise up to ₹385 by 2026, offering an approximate +60.91% return on its 2024’s closing price of ₹239.25.
ONGC Share Price Target for 2027 (month-wise)
As per our analysis of ONGC share target 2027, we are expecting that the prices may rise up to ₹482, offering an approximate +101.46% return on its 2024’s closing price of ₹239.25.
🚀 Can HYUNDAI MOTORS speed up your portfolio growth in 2025? Read this to find out…
Conclusion
Also, explore our FAQ section for any additional queries, and let us know your thoughts by rating this post. Your feedback and suggestions are always appreciated! 🤑HAPPY INVESTING🤑.
Frequently Asked Questions (FAQs)
1) Is ONGC a good share to buy?
As per our analysis, we recommend Oil & Natural Gas Corporation Ltd. (BSE, NSE : ONGC) as a DECENT BUY for an investor. Considering its Govt. of India holdings & low competition sector, this company can become a pillar of your portfolio. As they deal in Oil & Gas (ENERGY), there scope for growth is endless.
2) What is the ONGC share price target for 2025?
₹308 is the ONGC share price target 2025 which is a ~29% return on 2024’s closing price of ₹239.25, as per our analysis.
3) What is the ONGC share price target for 2050?
By 2050, the ONGC share price target could be around ₹28,820 (without considering any split).
4) What is the ONGC share price target for 2040?
₹5580 (without considering any split) on 2024’s closing price of ₹239.25, as per our analysis. is the ONGC share price target 2040 which is ~2233% return on 2024’s closing price of ₹239.25, as per our analysis.
5) What is the ONGC share price target for 2030?
As per our analysis, ONGC share target can be a high of ₹902 in 2030.
6) What can be the ONGC share price target tomorrow?
Since ONGC share’s average daily move is around +/- 1.75%. We can estimate +1.75% or -1.75% of previous day’s close for ONGC share price target tomorrow.
7) What can be the ONGC share price target next week?
Since ONGC share’s average weekly move is around +/- 3.50%. We can estimate +3.50% or -3.50% of previous week’s close for ONGC share price target next week.
📈 EaseMyTrip can be a sponsor to you next trip, if you invest in it for long term. Read this to find out how..
Disclaimer : Not an Investment Advice
The content shared in the article “ONGC Share Price Target Tomorrow, 2025 to 2030, 2040, 2050” is for general information only. It’s not intended as financial, investment, or professional advice. Always consult a qualified professional—whether legal, financial, or tax-related—before making any investment decisions.